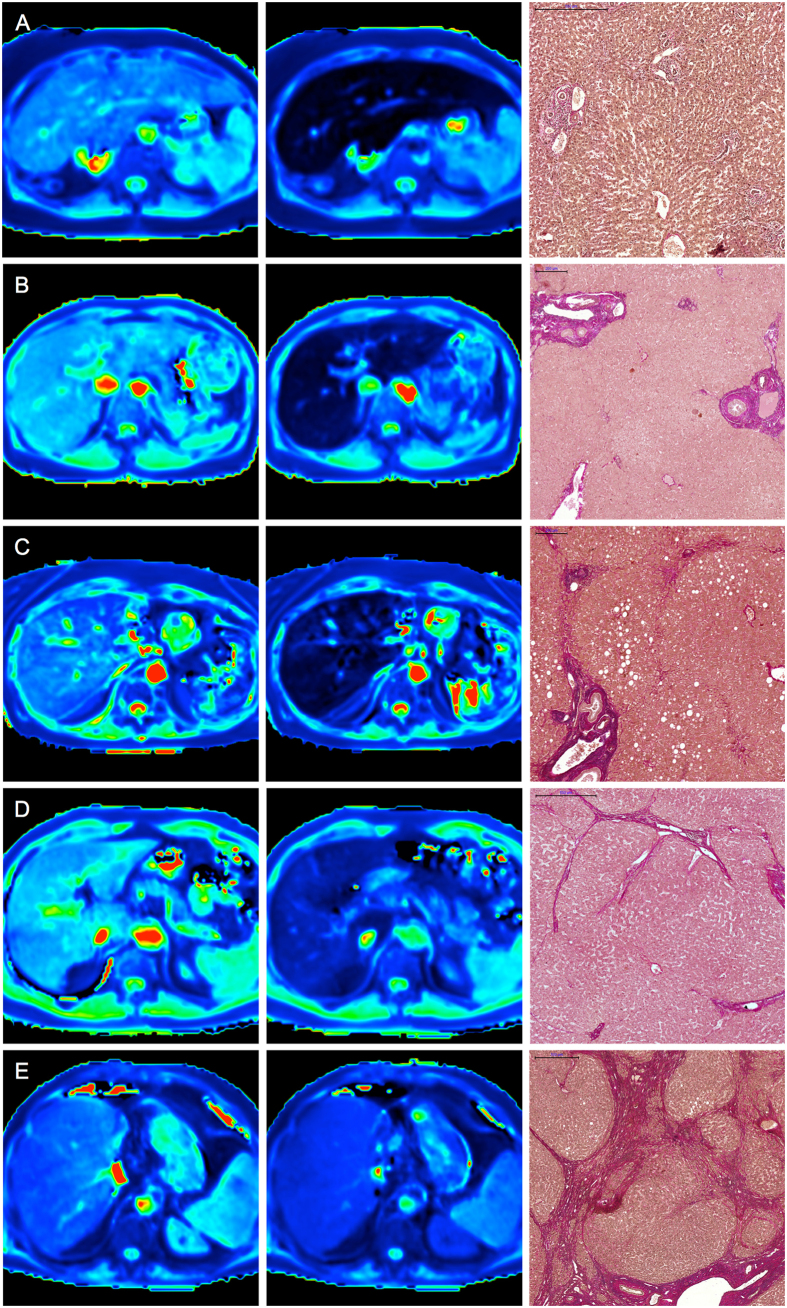
Figure 3. T1 maps and histopathological images.
Color-coded T1 maps comparing the precontrast and hepatobiliary phases of a patient with normal liver parenchyma (F0, A) and those of patients with different stages of liver fibrosis (METAVIR stages F1–F4, B–E) with the corresponding EVG-stained histopathological images. The T1 maps calculated from the 3D VIBE sequences (TR 5.79 ms, TE 2.46 ms) with inline corrections for B1 heterogeneities were obtained before and 20 min after the administration of Gd- EOB-DTPA. The scale on the histopathology images represents 500 μm (A,D,E) and 200 μm (B,C), respectively. The reduction rates of the T1 relaxation times between the precontrast and Gd-EOB-DTPA-enhanced images were as follows: (A) no liver fibrosis (F0), rrT1: 0.71; (B) mild liver fibrosis (F1), rrT1: 0.63; (C) advanced liver fibrosis (F2), rrT1: 0.52; (D) severe liver fibrosis (F3), rrT1: 0.41; and (E) liver cirrhosis (F4), rrT1: 0.28.

