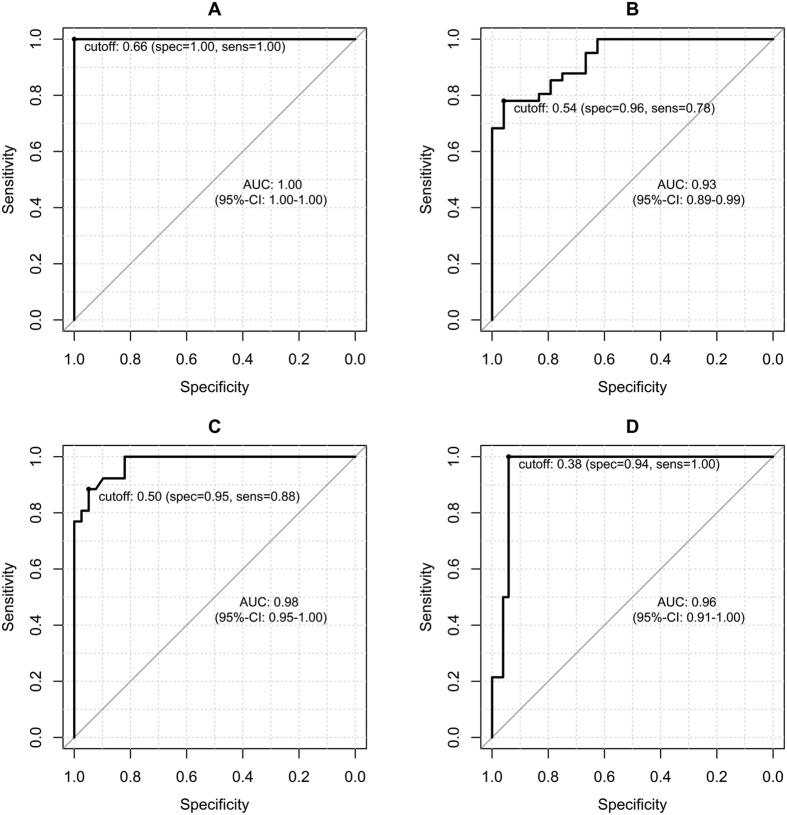
Figure 4. ROC analysis.
Graphs showing the ROC curves for the reduction rates of the T1 relaxation times (rrT1) for the diagnoses of liver fibrosis in the patients with (A), METAVIR stage 1 or greater fibrosis (≥F1; rrT1, cutoff 0.66), (B), stage 2 or greater fibrosis (≥F2; rrT1, cutoff 0.54), (C), stage 3 or greater fibrosis (≥F3; cutoff 0.50), and (D), stage F4 fibrosis (rrT1, cutoff, 0.38).

