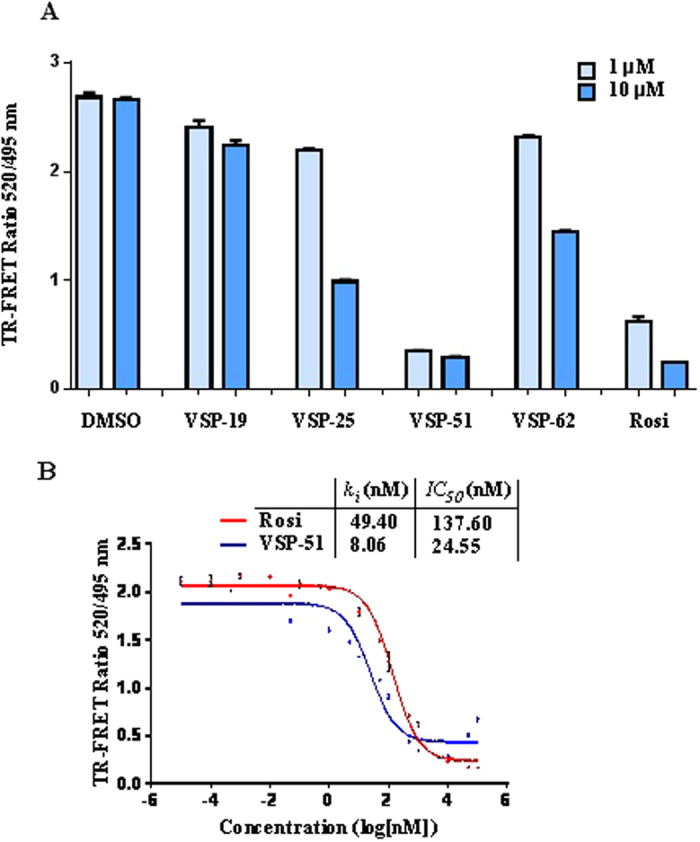
Figure 3. Characterization of VSP-51 binding.

LanthaScreen TR-FRET assay (Invitrogen) was used for determining the relative binding affinities of the ligands VSP-19, 25, 51, 62 and Rosi. GST-PPARγ LBD and the fluorescent PPARγ ligand Fluormone™ were used at 0.5 nM of concentration, each. Terbium-coated anti-GST antibody was used at 4.95 nM of concentration. (A) LanthaScreen TR-FRET ratios for ligands at 1 and 10 μM of concentrations (n = 2, error bars = SEM). (B) Dose-response competition curves VSP-51 and Rosi in the range from 0.01 pM - 100 μM. Concentrations are presented on a log10 scale (n = 2, error bars = SEM).
