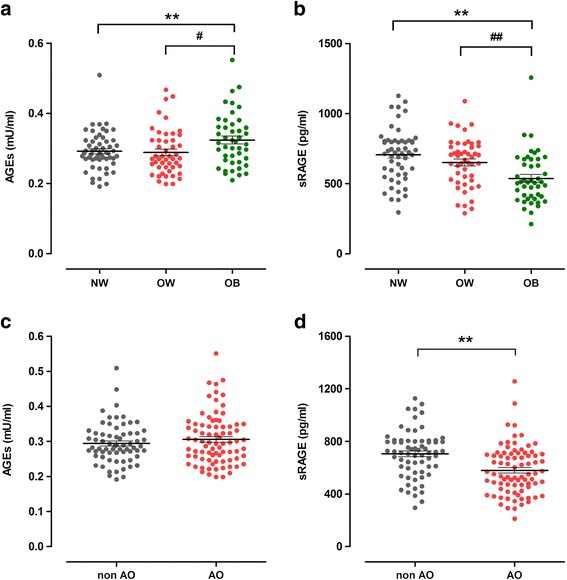
Fig. 1.

The levels of AGEs and sRAGE in different groups were divided according to anthropometric parameters. Data are mean ± SE. AGEs, advanced glycation end products. sRAGE, soluble receptor of AGEs. BMI, body mass index. WC, waist circumference. a and b represent the levels of serum AGEs and sRAGE in different groups were divided according to BMI. NW, the normal weight group (BMI <24 kg/m2, n = 53). OW, the overweight group (24 ≤ BMI < 28 kg/m2, n = 50). OB, the obesity group (BMI ≥ 28 kg/m2, n = 45). P value for analysis of variance for differences between groups: * < 0.05 compared with NW, ** < 0.01 compared with NW. # < 0.05 compared with OW, ## < 0.01 compared with OW. c and d represent the levels of serum AGEs and sRAGE in different groups were divided according to WC. non AO, non-abdominal obese group (WC ≤85 cm, n = 67). OA, abdominal obese group (WC >85 cm, n = 81). P value for analysis of variance for differences between groups: * < 0.05, ** < 0.01
