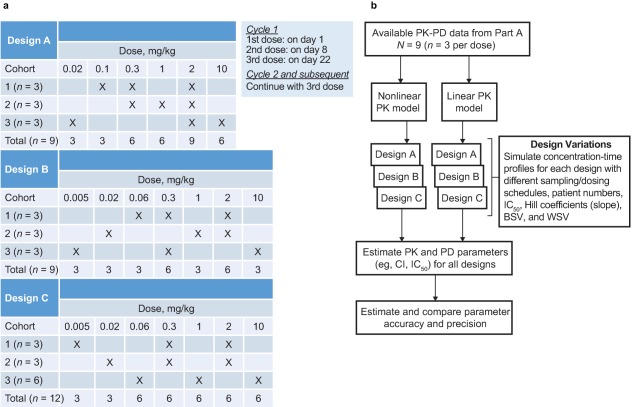
Figure 2.

Overview of trial design variations and method for evaluating them. (a) Overview of the three study designs. Each design started with a low dose (0.005 or 0.02 mg/kg) and escalated to either 2 or 10 mg/kg every 3 weeks. Two designs (A and B) differed with respect to the starting dose (0.02 or 0.005 mg/kg, respectively) and the subsequent dose (0.1 mg/kg or 0.06 mg/kg, respectively). In the third design (C), 3 additional patients were included in one group in order to achieve a balanced number per dose level, or 12 patients in total (4 per group), whereas the other designs included 9 patients. For design A, an additional 6 patients per group, and for design B, an additional 4, 6, and 8 patients per group were evaluated to establish the influence of sample size. Thus, the total number of design variations evaluated was seven. (b) Flow chart of design evaluation. With 20 scenarios per design variation, a total number of 140 sets were simulated and reestimated, 100 times each (in total, 14,000 trial simulations). BSV, between‐subject variability; CI, confidence interval; IC50, the concentration of pembrolizumab required to cause 50% inhibition of the IL‐2 stimulation ratio; PK‐PD, pharmacokinetic‐pharmacodynamic, WSV, within‐subject variability.
