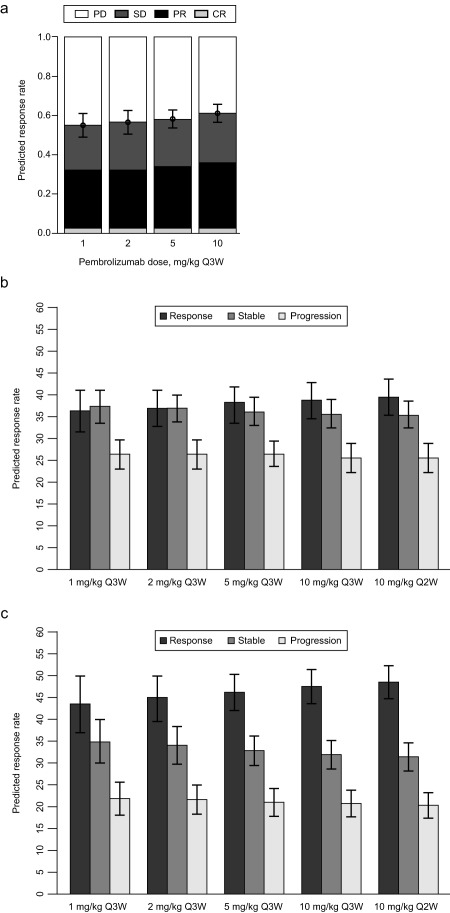
Figure 3.

(a) Median response rates at week 28 for the different response categories of 1,000 simulated trials, each with 10,000 patients (mixture model). Median simulated response rates for patients whose tumor is positive for programmed death receptor 1 ligand 1 (PD‐L1) at week 24 for dose schedules ranging from 1 mg/kg every 3 weeks (Q3W) to 10 mg/kg every 2 weeks (Q2W), using the consolidated model structure; (b) ipilimumab‐pretreated patients; and (c) ipilimumab‐naive patients. Error bars represent the 90% confidence intervals around the estimates. Response is defined as change from baseline (CFB) ≤−30%; stable is defined as CFB −30 to −20%; progression is defined as CFB ≥20%. CR, complete response; PD, progressive disease; PR, partial response; SD, stable disease.
