
Figure 3.
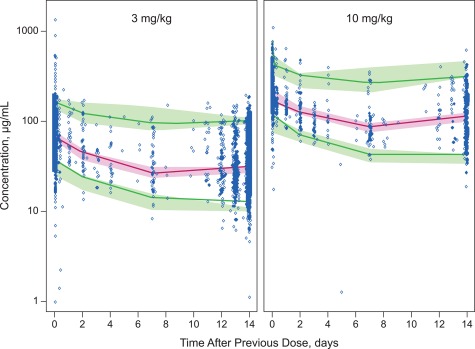
Model validation representative visual predictive check from final population pharmacokinetic model: nivolumab concentration vs. actual time after dose. Representative visual predictive check of concentration (log scale) vs. actual time after previous dose for 3.0 mg/kg and 10.0 mg/kg Q2W doses. Dots are observed data and the solid lines represent the 5th, 50th, and 95th percentiles of observed data, respectively. The shaded areas represent the simulation‐based 90% confidence intervals for the 5th, 50th, and 95th percentiles of the predicted data. Q2W, every 2 weeks.