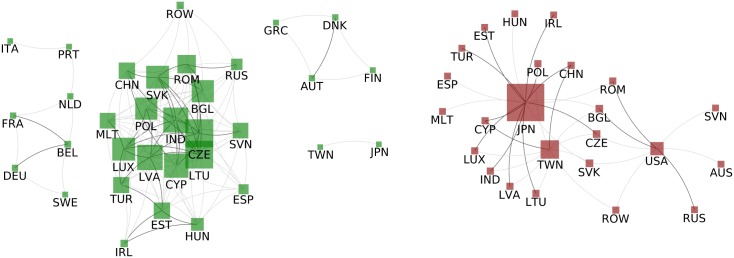
Fig 6. Countries Normalised Strength correlation.
Left: Correlated countries - Two countries are connected with a dark grey link if the Pearson coefficient between their strengths time series is above if the coefficient is only above the link is light grey. Right: Anticorrelated countries - Two countries are connected in dark grey if their strengths time series have a Pearson coefficient below if the coefficient is only below the link is light grey. In both the size of of the nodes is proportional to the strength of the node (regarding light edges).

