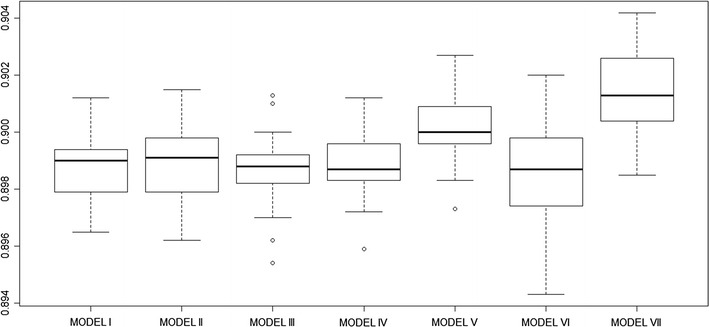
Fig. 3.

Box plot comparing accuracy assessment statistic AUC after 25 bootstrap runs for seven BRT models constructed in the analysis. AUC comparison for each of the four main models with Urbanization classification derived from GRUMP UE (Model I), CSO urban (Model II), Modified GRUMP UE (Model III) and MODIS urban (Model IV). The AUC values are then compared to values obtained from models that included population density (Model V). Model VI only includes the common set of confounding variables used in the other models and excludes any urban classification and population density while Model VII includes both the population density and urbanization (CSO urban)
