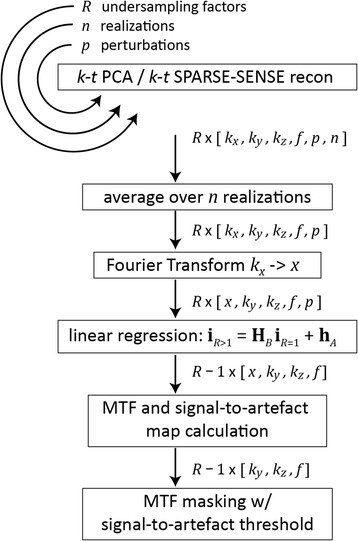
Fig. 2.

Workflow for the simulation of modulation transfer functions (MTFs). Image reconstruction is repeated for R undersampling factors, n times, and for p different perturbations. The reconstruction results are averaged over the realizations, and Fourier transformed along the frequency encode direction, since no undersampling is applied in this direction. Linear regression yields the maps h A and H B for calculation of the MTF and the signal-to-artefact maps. Finally, signal-to-artefact maps are used to mask the MTF results
