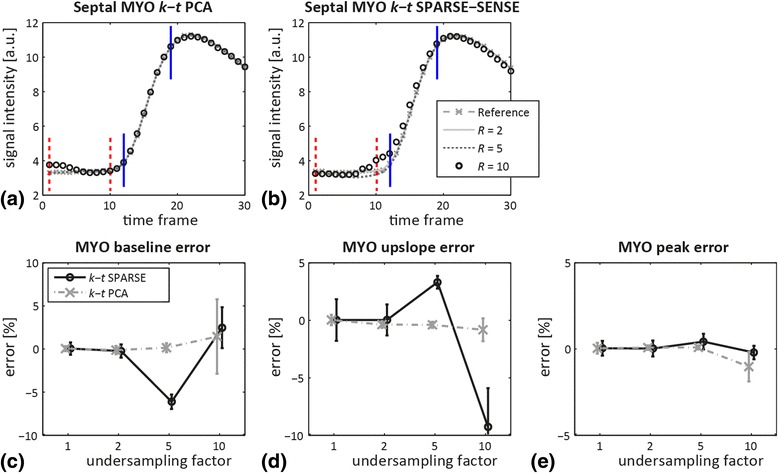
Fig. 5.

Myocardial (MYO) signal intensity vs. time derived from the septum in 3D MRXCAT simulations for different undersampling factors and signal intensity errors. Myocardial curves from reconstructions using (a) k-t PCA and (b) k-t SPARSE-SENSE for fully sampled reference, and undersampling factors R = 2, 5, 10. Baseline (dashed red) and upslope limits (solid blue) are indicated in (a,b). c-e Percentage errors as a function of the undersampling factor in (c) baseline, (d) upslope and (e) peak signal. Error bars indicate mean and twice the standard deviation across 10 realizations of the simulation
