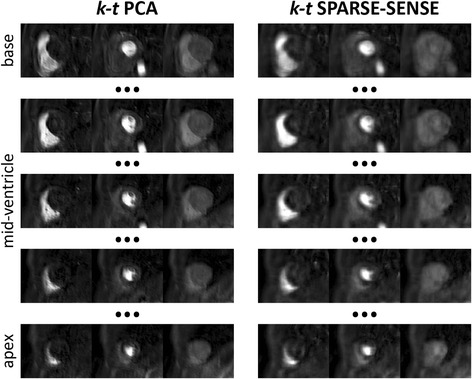
Fig. 9.

Example short-axis slices of in-vivo images using 10-fold accelerated k-t PCA and 10x k-t SPARSE-SENSE perfusion imaging in one volunteer. Time frames of peak contrast enhancement in the right ventricle, left ventricle and myocardium are shown in 5 slices from base to apex (gap of 1 slice between the shown slices)
