Fig. 1.

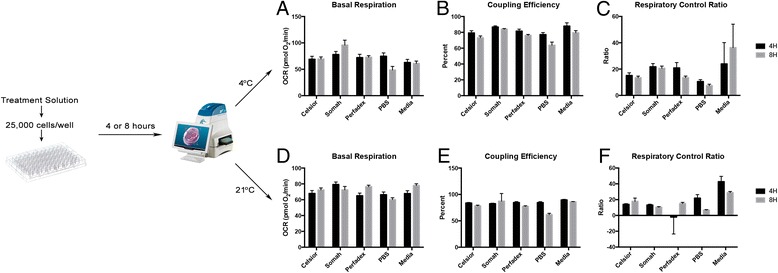
Experimental Design Flow Chart. The conditions of the experiment were performed as shown, with data plotted for both 4 and 8 h time points under 4 °C in panels a-c and under 8 °C in panels d-f

Experimental Design Flow Chart. The conditions of the experiment were performed as shown, with data plotted for both 4 and 8 h time points under 4 °C in panels a-c and under 8 °C in panels d-f