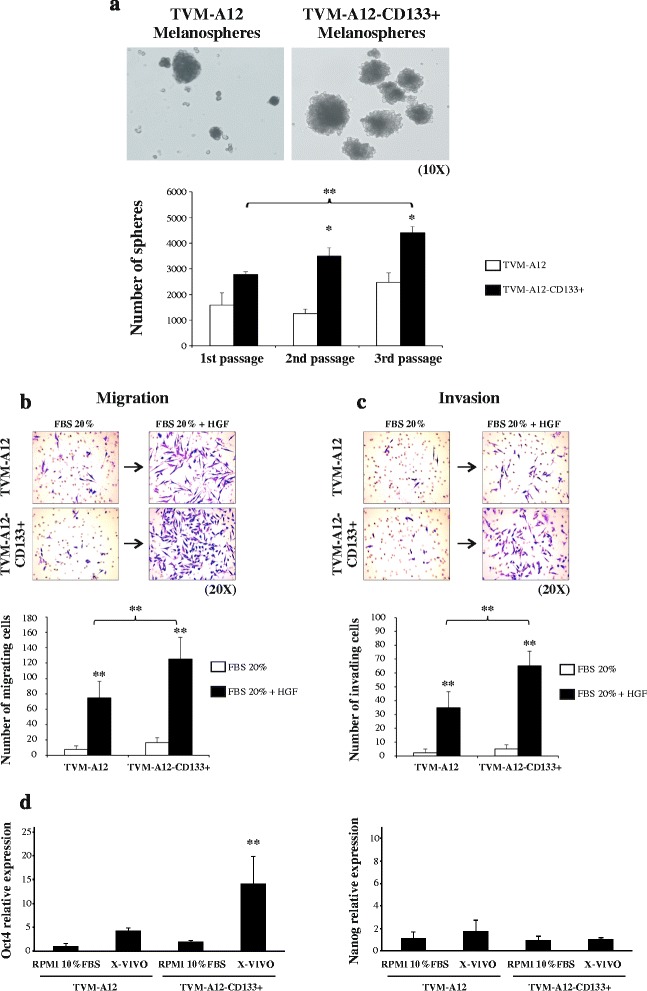
Fig. 3.

TVM-A12-CD133+ cells are endowed with CSCs features more than the parental TVM-A12 cells. a TVM-A12-CD133+ melanoma cells show higher self-renewing potential than TVM-A12 cells. Top panels represent the microscopy pictures of melanospheres from TVM-A12 cells (left) and TVM-A12-CD133+ cells (right); magnification 10x. Bar graph displays the self-renewing efficiency difference between TVM-A12 and TVM-A12-CD133+ cells in 2nd passage (p = 0.004) and 3rd passage (p = 0.012) and between 1st and 3rd passage of TVM-A12-CD133+ cells (** p < 0.001). b TVM-A12-CD133+ cells display higher migratory capacity than TVM-A12 cells. Top panels represent the microscopy pictures of TVM-A12 and TVM-A12-CD133+ migrated through the transwell insert: magnification 20x. Bar graph shows the migration capacity of TVM-A12 and TVM-A12-CD133+ cell lines in the presence or not of 40 ng/ml HGF (** p < 0.001). c TVM-A12-CD133+ cells display higher invasive capacity than TVM-A12 cells. Top panels represent the microscopy pictures of TVM-A12 and TVM-A12-CD133+ invasive cells through Matrigel coated transwell inserts: magnification 20x. Bar graph shows the invasive capacity difference between TVM-A12 and TVM-A12-CD133+ cell lines in the presence or not of 40 ng/ml HGF (** p < 0.001). ImageJ software was used to count total migrated and invasive cells. p-values (* p ≤ 0.050; ** p < 0.001). d Expression of the core stem cells transcriptional factor Oct4 (left panel) and Nanog (right panel). Data represent the results of three independent experiments
