
Fig. 2.
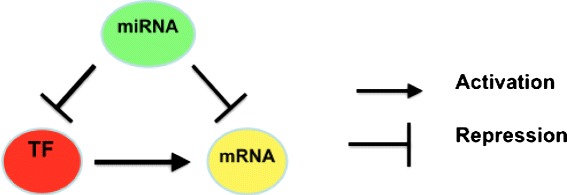
Example of a feed-forward loop. The figure depicts a simple graph modeling the interactions among miRNA (green node), mRNA (yellow node), and TF (red node) through two different kinds of edges. In particular, the figure depicts a miRNA that negatively regulates (repression) TF and mRNA and a TF that positively regulates (activation) a mRNA