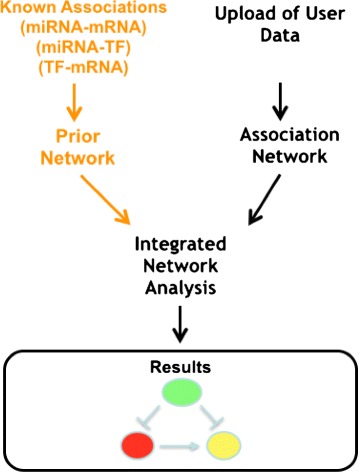
Fig. 5.

Analysis through mirConnX web server. The figure depicts the workflow of analysis on the mirConnX web server. Prior to the upload of user data, curators of the web server have produced a network of association among miRNAs, mRNAs, and TFs on a genome-wide scale for human and mouse. The user may upload his/her own data (miRNA and mRNA expression), and the web server builds the association network. Then, two networks are compared and FFLs are evidenced. Finally, results are presented to the user
