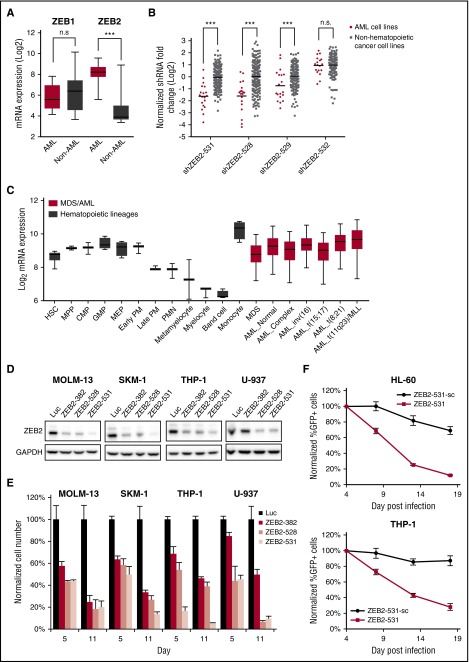
Figure 3.
Human AML cell lines are sensitive to ZEB2 inhibition. (A) Box plot showing mRNA expression levels of ZEB1 and ZEB2 in CCLE3 cell lines, comparing AML cell lines vs non-AML cancer cell lines. ***P < .001; n.s., not significant, t test. (B) shRNA fold depletions of ZEB2 shRNAs in the human cell line screen. ***P < .001; n.s., not significant, PARIS analysis.9 (C) ZEB2 expression in hematopoiesis25 and AML.4 Error bars indicate 5% to 95% percentile. (D) Immunoblotting of ZEB2 at day 6 after shRNA lentivirus infection. (E) Viability of AML cells after ZEB2 knockdown. Error bars, standard deviation (SD) (n = 3). (F) Competitive proliferation assays of AML cells infected with ZEB2 shRNA (ZEB2-531) and its seed control (ZEB2-531-sc). Graph shows normalized cell number as a percentage of the first time point (4 days after infection). Error bars, SD (n = 3). AML_Complex, complex karyotype; AML_Normal, normal karyotype; CMP, common myeloid progenitor cell; GMP, granulocyte monocyte progenitors; HSC, hematopoietic stem cell; Luc, shRNA targeting firefly luciferase; MDS, myelodysplastic syndrome; MEP, megakaryocyte-erythroid progenitor cell; MPP, multipotential progenitors; PM, promyelocyte; PMN, polymorphonuclear cells; ZEB2-382, shRNA targeting ZEB2.

