
Figure 1.
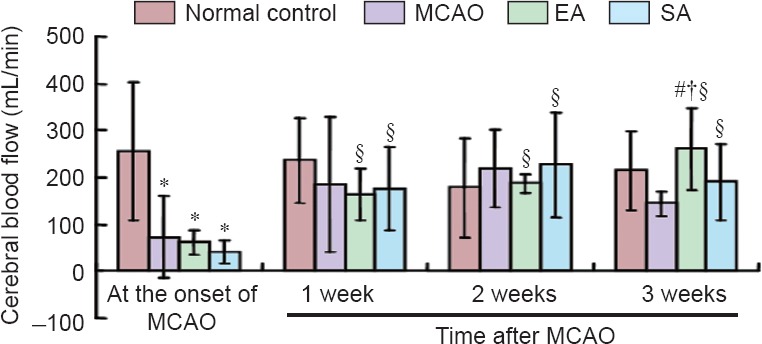
Cerebral blood flow among the various groups.
All data are presented as the mean ± SD. Analysis of variance was used for among-group comparison, followed by two-sample t-test for between-group comparison. Paired t-test was used for within-group comparison. *P < 0.05, vs. normal control group; #P < 0.05, vs. MCAO group; †P < 0.05, vs. SA group; §P < 0.05, vs. the onset of MCAO. MCAO: Middle cerebral artery occlusion; EA: electroacupuncture; SA: sham electroacupuncture.