Table 3.
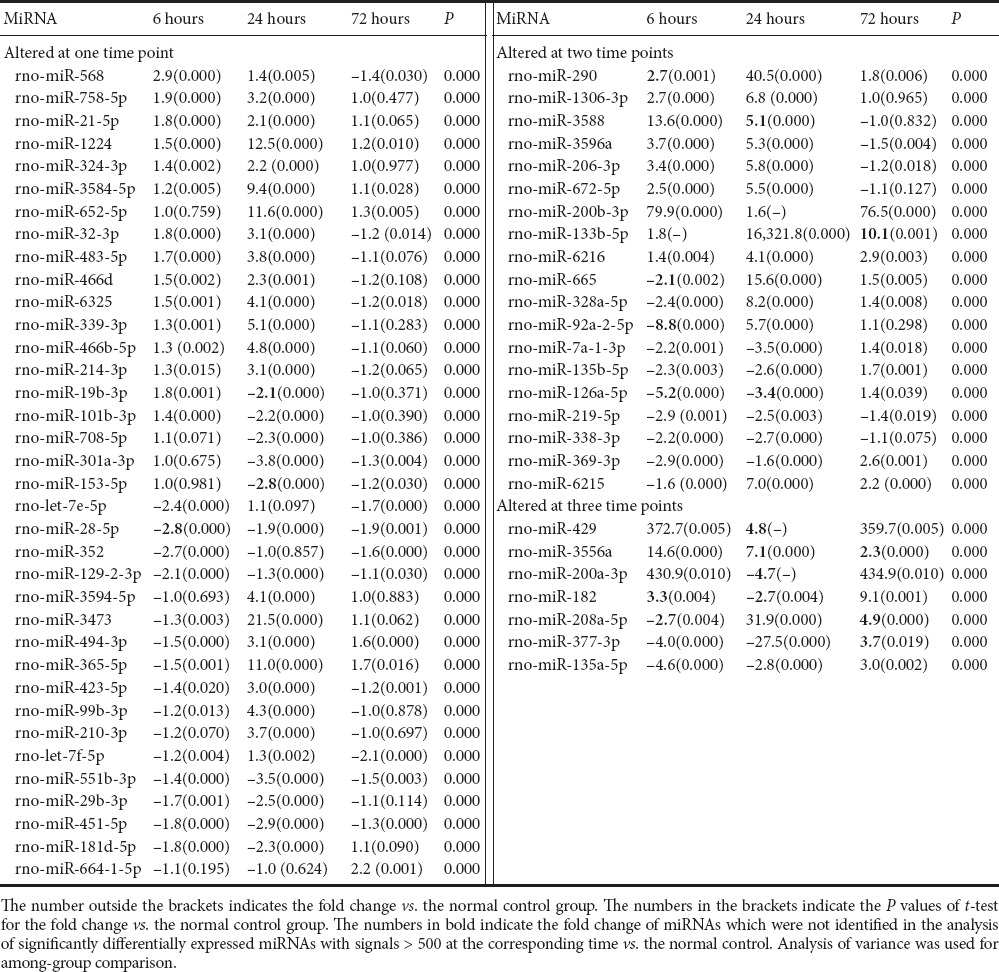
Fold change of significantly differentially expressed (> 2-fold or < −2-fold) miRNAs between middle cerebral artery occlusion and normal control groups

Fold change of significantly differentially expressed (> 2-fold or < −2-fold) miRNAs between middle cerebral artery occlusion and normal control groups
