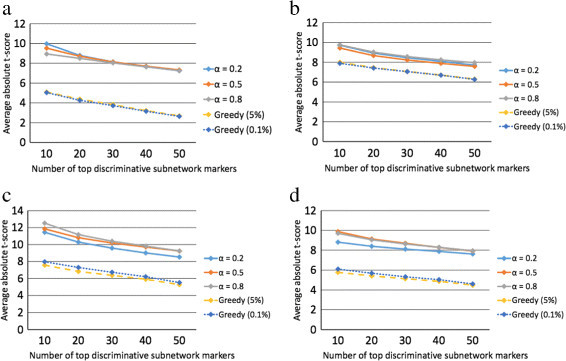
Figure 2.

Discriminative power of the identified subnetwork markers. We computed the mean absolute t-test statistics score of the top K = 10, 20, 30, 40, and 50 subnetwork markers identified by different methods for the following datasets: (a) USA, (b) Netherlands, (c) Belgium, and (d) Sweden.
