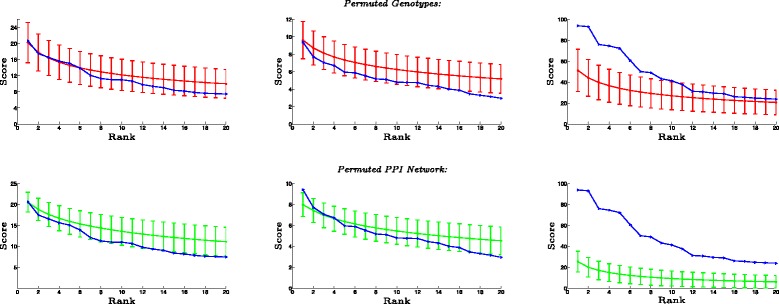
Fig. 2.

Statistical significance of subnetworks. Statistical significance of high-scoring subnetworks identified using NODE-BASED scoring (first column), LINEAR COMBINATION of node scores and edge scores (second column), and MODULARITY-BASED (MOBAS) scoring (third column). The highest scoring 20 subnetworks identified using each scoring scheme are shown. The x-axis shows the rank of each subnetwork according to their score, and the y-axis shows its score. The blue curve shows the scores of the subnetworks identified on the WTCCC-T2D dataset. For each i on the x-axis, the red (green) curve and error bar in the first (second) row show the distribution of the scores of i highest scoring subnetworks in 100 datasets obtained by permuting the genotypes of the samples (permuting the interactions in the PPI networks while preserving node degrees)
