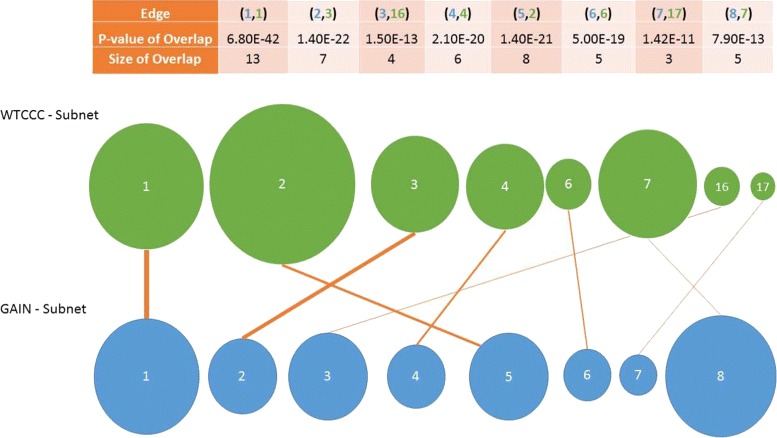
Fig. 5.

Reproducibility of identified subnetworks using MOBAS in two independent datasets. The size of the circles represents the size of identified subnetwork. The thickness of the edges represents the significance of overlap between the two subnetwork based on hypergeometric distribution
