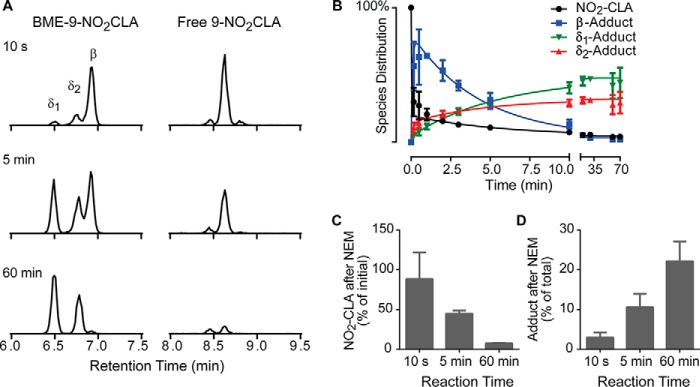
FIGURE 4.
LC-MS/MS analysis of the reaction between NO2-CLA and BME. A, purified 9-NO2-CLA (10 μm) was reacted with BME (1.76 mm), and aliquots were obtained at 10 s (top), 5 min (middle), and 60 min (bottom) for analysis of free NO2-CLA (right) and BME-NO2-CLA adducts (left). B, representative time course for 9-NO2-CLA reaction with BME. C and D, aliquots collected at the indicated times were incubated with NEM (100 mm), and the percentage of free NO2-CLA with respect to that at time 0 (C) and the percentage of BME-NO2-CLA adduct with respect to NEM-untreated controls (D) were determined. Data are representative of three independent experiments.

