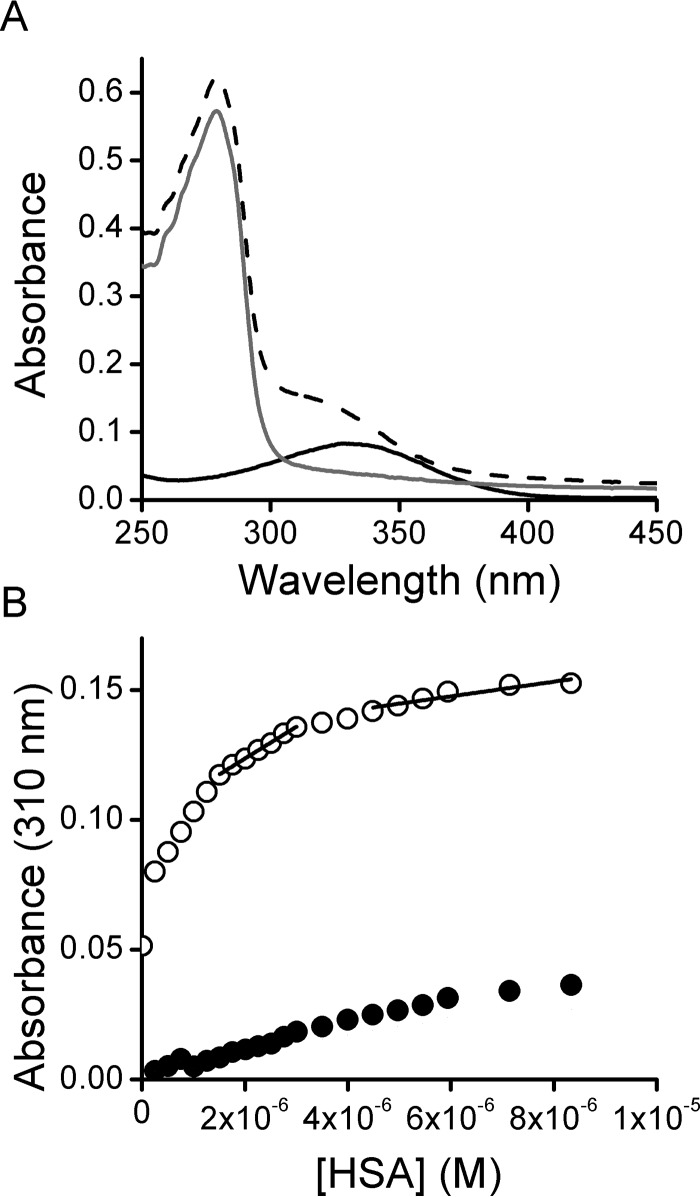
FIGURE 9.
NO2-CLA binding to HSA. A, UV-Visible spectra of 16 μm thiol-blocked delipidated HSA (gray trace), 10 μm NO2-CLA (black trace), and the combination of both reagents (dashed trace). B, thiol-blocked delipidated HSA (0.2–10 μm) was mixed with NO2-CLA (10 μm), and UV-visible spectra were recorded. The absorbance at 310 nm was plotted against HSA concentration, and the amount of NO2-CLA bound was determined from the change in the slope (open circles). A control without NO2-CLA was included (black circles).

