
FIGURE 1.
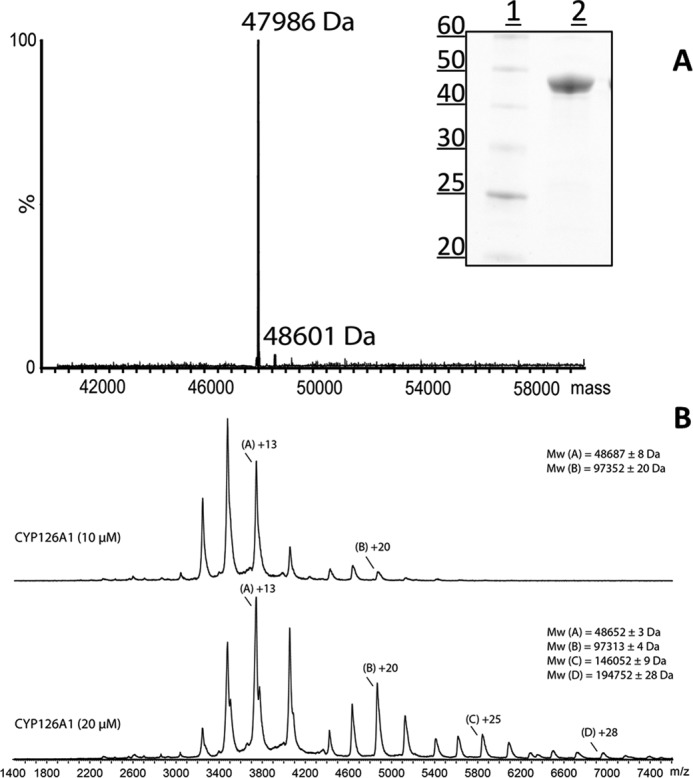
Purification and mass spectrometry of CYP126A1. A, the main image shows the native mass spectrum of CYP126A1. The major feature at 47,986 Da is consistent with the predicted mass of the His-tagged CYP126A1 apoprotein following removal of the initiator methionine (47,986.12 Da). The minor feature (48,601 Da) is consistent with the mass for the heme-bound CYP126A1 holoprotein. The inset shows an SDS-polyacrylamide gel with molecular mass markers (sizes in kDa) in lane 1 and a sample of purified CYP126A1 in lane 2. B, nano-ESI native mass spectra data of ligand-free CYP126A1 at concentrations of 10 μm (top spectrum) and 20 μm (bottom spectrum). For the 10 μm sample, differently charged species are labeled A (for monomer) and B (for a minor dimer species). For the 20 μm sample, species are labeled A–D for the monomer through tetramer forms. Apparent masses of these different species are indicated.