FIGURE 3.
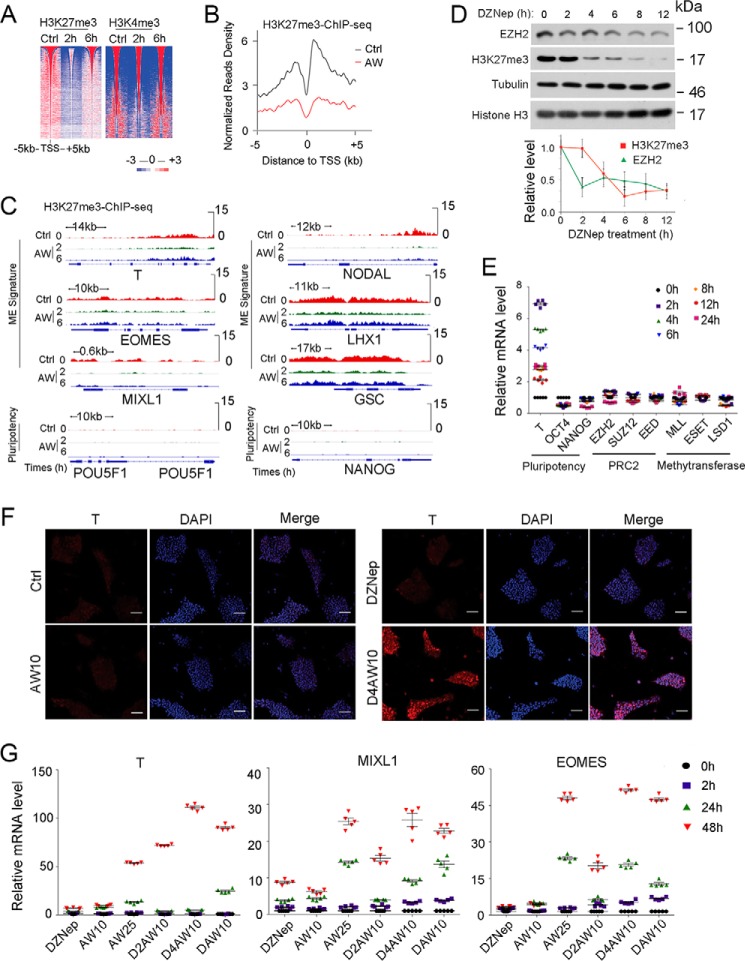
H3K27me3 reduction facilitates ME initiation. A, heat map of H3K27me3 and H3K4me3 intensity centered at all of the detected peaks after H1 cells were treated with 25 ng/ml AW for 2 or 6 h before they were harvested for anti-H3K27me3 and anti-H3K4me3 ChIP-seq. B, mean ChIP-seq intensity profile showed the decrease of H3K27me3 around the TSS of AW enhanced genes. Valuable peaks were sorted by peak size. Pluripotent H1 cells were used as a control. C, IGV showed H3K27me3 enrichment at 2 and 6 h on ME and pluripotency genes as revealed by H3K27me3 ChIP-seq upon AW treatment. D, H1 cells were treated with 10 ng/ml DZNep in B27 medium for the indicated times before they were harvested for anti-EZH2 immunoblotting or for histone extraction followed by anti-H3K27me3 and anti-histone H3 immunoblotting. The relative levels of H3K27me3 and EZH2 were shown after normalization with histone H3 or tubulin, respectively. E, H1 cells were treated with 10 ng/ml DZNep for indicated times before they were harvested for qPCR. F, H1 cells were pretreated with 10 ng/ml DZNep for 4 h (D4) before they were treated with 10 ng/ml both activin A and Wnt3a (AW10) for another 24 h, and then cells were harvested for anti-T immunofluorescence. The nucleus was counterstained with DAPI. Scale bar, 100 μm. G, H1 cells were pretreated with or without 10 ng/ml DZNep for 2 h (D2) or 4 h (D4) before 10 ng/ml both activin A and Wnt3a were added for another 2, 24, and 48 h. Then the cells were harvested for qPCR. DAW10, 10 ng/ml DZNep plus AW10. 25 ng/ml AW (AW25) was used as the positive control for ME differentiation. The statistical data are shown as mean ± S.E. (error bars) (n = 15, including 5 biological replicates and 3 technical replicates for E and G; n = 9, including 3 biological replicates and 3 technical replicates for D; n = 3, including 3 biological replicates for F). The Friedman test was performed in D.

