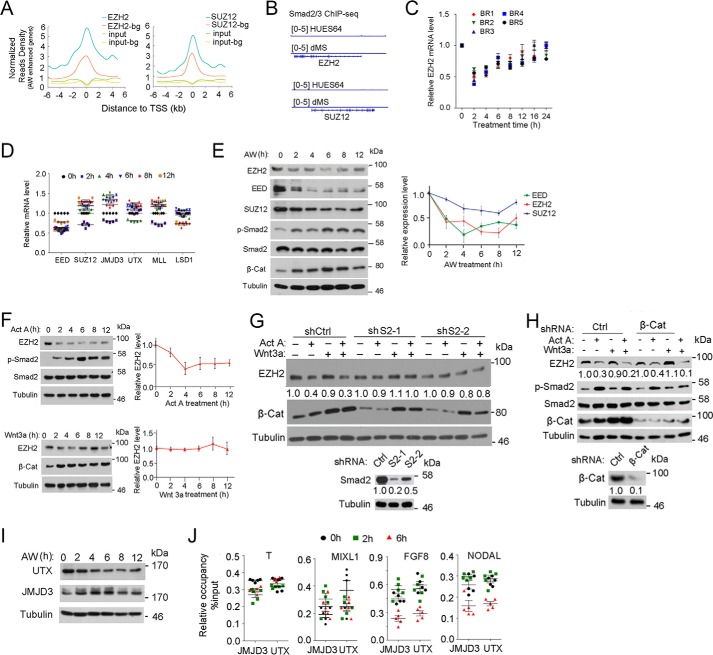
FIGURE 6.
Activin/Smad2 signaling decreases EZH2 protein levels. A, mean ChIP-seq profile for EZH2 and SUZ12 in H1 cells (GSE32509) at ±5 kb around the TSS of AW-enhanced genes together with background (bg) genes. 1477 background genes that show random response were selected as having −0.05 < PCC < 0.05 with T, EOMES, and MIXL1. B, IGV was performed on the Smad2/3 ChIP-seq data to show the occupancy of Smad2/3 on EZH2 and SUZ12 promoters. C, H1 cells were treated with 25 ng/ml AW for the indicated times before they were harvested for qPCR to assess EZH2 mRNA expression. BR, biological replicate. D, H1 cells were treated with 25 ng/ml AW for the indicated times before they were harvested for qPCR. E, H1 cells treated with 25 ng/ml AW for they indicated times before they were harvested for immunoblotting against EZH2, SUZ12, and EED. Phospho-Smad2 and β-catenin levels indicate activin and Wnt signaling activities, respectively. EZH2, SUZ12, and EED bands were quantified, and the relative levels were shown after normalization to tubulin. F, H1 cells treated with 25 ng/ml activin A or 25 ng/ml Wnt3a for the indicated times before they were harvested for anti-EZH2 immunoblotting. EZH2 bands were quantified, and the relative levels were shown after normalization to tubulin. G, Smad2 knockdown H1 cells were treated with 25 ng/ml activin A, 25 ng/ml Wnt3a, or both for 2 h before they were harvested for anti-EZH2 immunoblotting. EZH2 and Smad2 bands were quantified. Knockdown efficiency of Smad2 is shown in the bottom panels. H, β-catenin knockdown H1 cells were treated with 25 ng/ml activin A, 25 ng/ml Wnt3a, or both for 2 h before they were harvested for anti-EZH2 immunoblotting. Phospho-Smad2 and β-catenin levels indicate activin and Wnt signaling activities, respectively; tubulin was used as a loading control. EZH2 and β-catenin bands were quantified and normalized to tubulin. Knockdown efficiency of β-catenin is shown in the bottom panels. I, H1 cells were treated with 25 ng/ml AW for the indicated times before they were harvested for anti-UTX or anti-JMJD3 immunoblotting. Tubulin served as a loading control. J, H1 cells were treated with 25 ng/ml AW for 2 or 6 h before they were harvested for anti-JMJD3 and anti-UTX ChIP followed by qPCR of the ME signature genes. The statistical data are shown as mean ± S.E. (error bars) (n = 15, including 5 biological replicates and 3 technical replicates for C, D, and J; n = 9, including 3 biological replicates and 3 technical replicates for E and F). A Friedman test was performed in E and F.

