FIGURE 9.
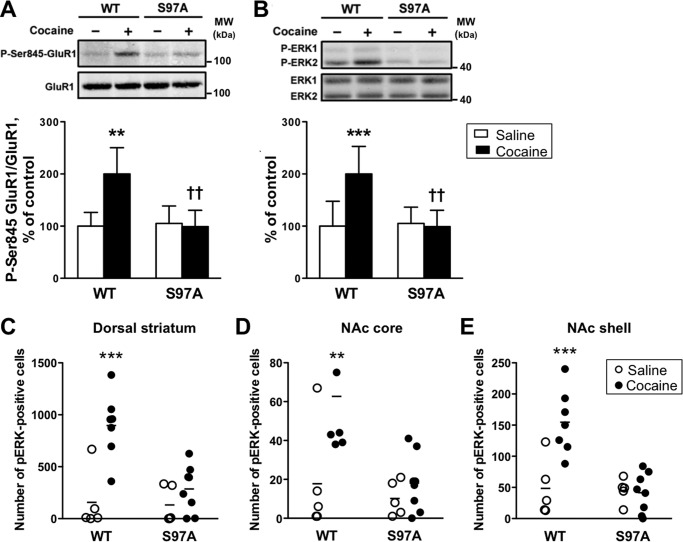
Cocaine-induced GluR1 and ERK phosphorylation in the striatum of DARPP-32 S97A mutant mice in vivo. A and B, WT and S97A mice were injected with saline (−, open bars) or cocaine 20 mg/kg (+, closed bars) and killed 10 min later. Frozen tissue from the dorsal striatum was used for phosphorylation analyses. A, phospho-Ser-845 (P-Ser-845-GluR1, upper panel) and total (lower panel) GluR1 were analyzed by immunoblotting. Results are expressed as ratios of phosphorylated/total protein and normalized to the mean of saline-treated wild type mice. Data for 5–7 mice per group represent the means ± S.D. and were analyzed using two-way ANOVA: interaction between genotype and treatment, F1,20 = 4.44, p < 0.05; effect of treatment, F1,20 = 6.55, p < 0.05; effect of genotype F1,20 = 9.08, p < 0.01. B, same as in A except that phospho-ERK1/2 (P-ERK1, P-ERK2, upper panel) and total ERK1 and ERK2 (lower panel) were studied. Because P-ERK1 was barely detectable in most experiments, only P-ERK2 has been quantified. Data for 5–7 mice per group represent the means ± S.D. and were analyzed using two-way ANOVA; interaction between genotype and treatment, F1,20 = 8.57, p < 0.01; effect of treatment, F1,20 = 6.74, p < 0.05; effect of genotype F1,20 = 7.03, p < 0.05. Bonferroni post-test: **, p < 0.01; ***, p < 0.001 cocaine versus saline; ††, p < 0.01 S97A versus WT. C–E, immunohistochemical analysis of P-ERK in the dorsal striatum (C), NAc core (D), and NAc shell (E) from wild type and S97A mice. WT and S97A mice were injected with saline (open bars) or cocaine 20 mg/kg (closed bars) and killed 15 min later. Numbers of P-ERK-positive cells above background were counted. Data (5–7 mice per group) were analyzed using two-way ANOVA. Dorsal striatum: interaction between genotype and treatment, F1,21 = 7.66, p < 0.05; effect of treatment, F1,21 = 17.78, p < 0.001; effect of genotype F1,21 = 8.96, p < 0.01. Bonferroni post-test: ***p < 0.001 cocaine versus saline. NAc core: interaction between genotype and treatment, F1,21 = 4.16, p = 0.054; effect of treatment, F1,21 = 8.49, p < 0.01; effect of genotype F1,21 = 8.29, p < 0.01. Bonferroni post-test: **, p < 0.01 cocaine versus saline. NAc shell: interaction between genotype and treatment, F1,21 = 11.45, p < 0.01; effect of treatment, F1,21 = 10.04, p < 0.01; effect of genotype F1,21 = 12.92, p < 0.01; Bonferroni post-test: ***, p < 0.001 cocaine versus saline.

