FIGURE 6.
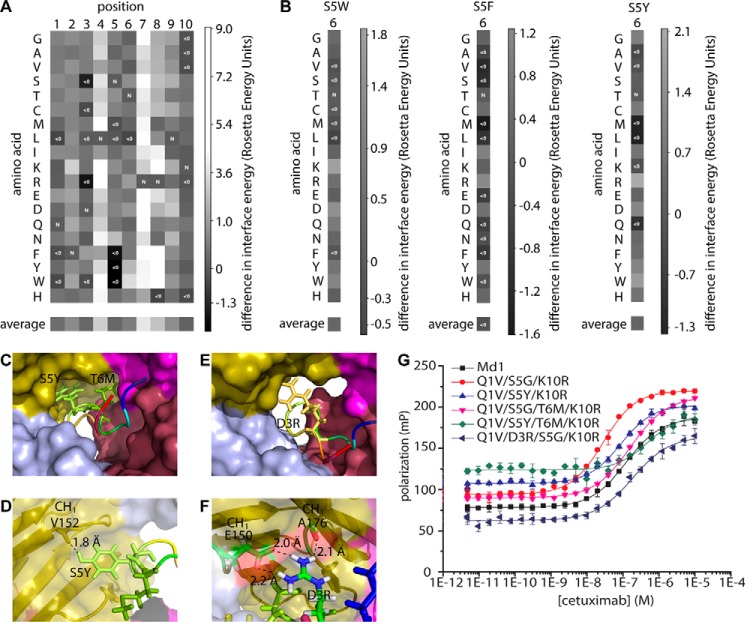
In silico modeling of meditope mutations. A, heat map of interaction free energies of cetuximab with single amino acid substitutions of the meditope generated by Rosetta modeling. Negative values (improved binding) is represented with dark shades of gray, and positive values (weaker binding than the original meditope) are represented with light shades of gray. Positions are shown on the horizontal axis. B, heat maps of interaction free energies of cetuximab with amino acid substitutions at position 6 of the meditope where position 5 is mutated to tryptophan (left), phenylalanine (middle), or tyrosine (right), generated by Rosetta modeling. Values are normalized to the respective single amino acid substitution at position 5. C, model of double mutant S5Y/T6M showing the position of the side chains that fill the empty space in the binding pocket. D, model of double mutant S5Y/T6M showing the possible hydrogen bond between tyrosine 5 of the meditope and valine 152 of the antibody. E and F, model of mutant D3R showing how the side chain of arginine 3 of the mediotope may fill empty space within the binding pocket (E) and possibly form hydrogen bonds with glutamine 150 and alanine 176 of the antibody (F). G, fluorescence polarization assay. Cetuximab was titrated to 10 nm of the indicated mutant peptides in PBS, pH 7.4, 1 mg ml−1 BSA. Error bars represent mean ± S.D. of triplicate measurements. The indicated mutations are with respect to Md1. For exact sequences see supplemental Table S2 peptides 13, 14, and 18–21.

