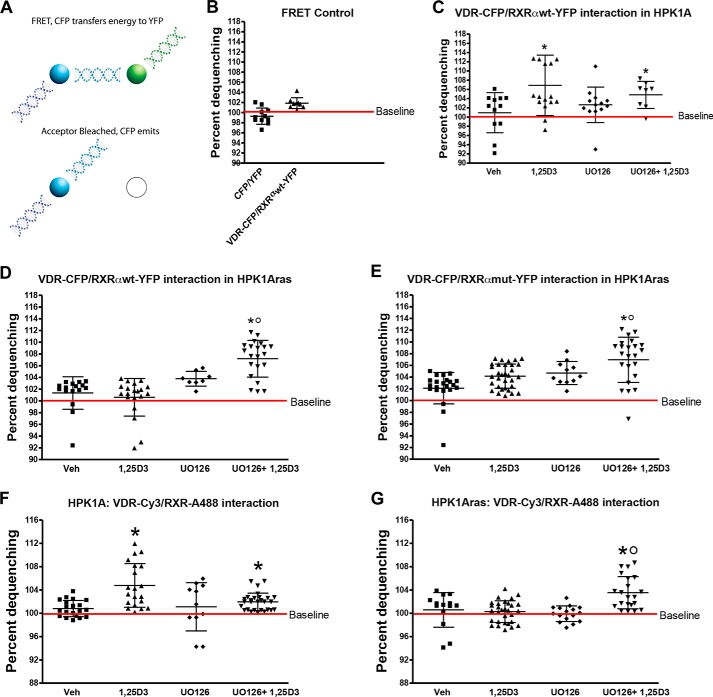
FIGURE 6.
Effects of RXRα phosphorylation on VDR and RXR interaction in HPK1A and HPK1ARas cells. A, FRET was measured by acceptor photobleaching as described under “Experimental Procedures.” Cells were co-transfected with either VDR-CFP/RXRαWT-YFP or VDR-CFP/RXRαmut-YFP. Following transfection, cells were treated with either vehicle (Veh), 1,25(OH)2D3 (1,25D3), UO126 alone, or a combination of UO126 and 1,25(OH)2D3 (C–E). B, HPK1A cells were co-transfected with either CFP/YFP (negative control) or VDR-CFP/RXRαWT-YFP plasmids. Similarly, both HPK1A (F) and HPK1ARas (G) cells were grown and treated with either vehicle, 1,25(OH)2D3, UO126 alone, or a combination of UO126 and 1,25(OH)2D3. The cells were then fixed and co-stained with VDR-Cy3 and RXRα-Alexa-488 antibodies to detect both endogenous VDR and RXRα. FRET was measured by acceptor photobleaching as described under “Experimental Procedures.” Scatter plots show FRET measurement of HPK1A cells co-transfected with VDR-CFP/RXRαWT-YFP (C) or co-stained with VDR-cy3 and RXRα-Alexa-488 antibodies (F). Similarly, in HPK1ARas cells scatter plots show cells co-transfected with either VDR-CFP/RXRαWT-YFP (D), VDR-CFP/RXRαmut-YFP (E), or co-stained with VDR-cy3 and RXRα-Alexa-488 antibodies (G). Values are mean percentage dequenching ± S.D. of at least 10 cells per treatment condition. FRET baseline was set at 100%. Asterisks indicate a significant difference in interaction between 1,25(OH)2D3 treatment alone compared with vehicle-treated control. Open circles indicate a significant difference in interaction between 1,25(OH)2D3-treated cells alone compared with combined UO126 and 1,25(OH)2D3 treatment. A p value of p < 0.05 was considered significant.

