Abstract
Objective
Spinal cord injury (SCI) is a devastating neurological trauma with a prevalence of about 282,000 people living with an SCI in the United States in 2016. Advances in neuromodulatory devices hold promise for restoring function by incorporating the delivery of electrical current directly into the spinal cord grey matter via intraspinal microstimulation (ISMS). In such designs, detailed topographic maps of spinal cord outputs are needed to determine ISMS locations for eliciting hindlimb movements. The primary goal of the present study was to derive a topographic map of functional motor outputs in the lumbar spinal cord to hindlimb skeletal muscles as defined by ISMS in a rat model.
Approach
Experiments were carried out in nine healthy, adult, male, Sprague Dawley rats. After a laminectomy of the T13-L1 vertebrae and removal of the dura mater, a four-shank, 16-channel microelectrode array was inserted along a three-dimensional (200 µm) stimulation grid. Trains of three biphasic current pulses were used to determine evoked movements and EMG activity. Via fine wire electromyographic (EMG) electrodes, Stimulus-Triggered Averaging (StTA) was used on rectified EMG data to determine response latency.
Main results
Hindlimb movements were elicited at a median current intensity of 6 µA, and thresholds were significantly lower in ventrolateral sites. Movements typically consisted of whole leg, hip, knee, ankle, toe, and trunk movements. Hip movements dominated rostral to the T13 vertebral segment, knee movements were evoked at the T13-L1 vertebral junction, while ankle and digit movements were found near the rostral L1 vertebra. Whole leg movements spanned the entire rostrocaudal region explored, while trunk movements dominated medially. StTAs of EMG activity demonstrated a latency of ~4 ms.
Significance
The derived motor map provides insight into the parameters needed for future neuromodulatory devices.
Keywords: Spinal Cord, Hindlimb, Sprague Dawley, Intraspinal Microstimulation, Topography
Introduction
Spinal cord injury (SCI) is a devastating neurological trauma that affects approximately 282,000 people living in the United States in 2016 (National Spinal Cord Injury Statistical Center 2016). In addition, there are approximately 17,000 new cases of SCI reported each year (National Spinal Cord Injury Statistical Center 2016). Whether it is a car accident, sports injury, work accident, fall at home, or war injury, SCI patients not only have to cope with the injury and a change of lifestyle but also the mental health problems of depression, anxiety, clinical-level stress, and post-traumatic stress disorder (Migliorini, Tonge et al. 2008). For returning service men and women, the most common war injury is a spine fracture representing 83% of all wounds and occurring in 91% of all casualties (Schoenfeld, Laughlin et al. 2013).
Weakness, incoordination, or paralysis occurs after SCI as a result of damage to ascending and descending axons that carry sensory-motor signals between the brain and the rest of the body. However, in a contused cord, many neuronal pathways above and below the lesion remain intact, providing a potential substrate for modifying and controlling motor neuron output through electrical stimulation approaches. Epidural stimulation of the spinal cord has been used frequently in both animal models and human subjects to restore some motor control even after neurologically complete SCI. Proposed mechanisms include activation of lumbar neuronal networks that are known as central pattern generators (Cazalets, Borde et al. 1995, Young 2015), direct or indirect activation of motor neuron pools (Angeli, Edgerton et al. 2014), or stimulation of afferent fibers in the dorsal roots (Harkema, Gerasimenko et al. 2011).
In contrast to epidural stimulation, intraspinal microstimulation (ISMS) involves the penetration of the spinal cord with microwire electrodes to stimulate within the ventral horn of the spinal cord, purportedly providing a spatially more specific form of stimulation. ISMS has been used to evoke functional motor responses in nonhuman primates (Moritz, Lucas et al. 2007, Zimmermann, Seki et al. 2011, Sharpe and Jackson 2014), cats (Mushahwar, Collins et al. 2000, Mushahwar and Horch 2000, Saigal, Renzi et al. 2004), and rats (Tresch and Bizzi 1999, Bamford, Putman et al. 2005, Kasten, Sunshine et al. 2013, Sunshine, Cho et al. 2013). Although ISMS is more invasive than epidural stimulation, implanted microwires can be mechanically stable (Mushahwar, Collins et al. 2000) and well tolerated by spinal cord tissue (Bamford, Todd et al. 2010). ISMS also requires substantially less current for eliciting movements as compared to epidural stimulation (Sharpe and Jackson 2014). Previously, ISMS has been used to study the forelimb (Kasten, Sunshine et al. 2013, Sunshine, Cho et al. 2013) and hindlimb (Tresch and Bizzi 1999, Bamford, Putman et al. 2005) motor outputs for potential recovery of function purposes. While detailed topographic maps of functional motor outputs have been produced in the cervical enlargement of the rat (Sunshine, Cho et al. 2013), there are currently no published topographic maps representing the functional motor outputs of the lumbar enlargement of the rat.
While it might be expected that motor outputs from ISMS are entirely predictable based on the columnar arrangement of motor neuron pools in the ventral horn, focal current delivery has been shown to generate complex synergistic movements (Bamford and Mushahwar 2011). The potential recruitment of large, functional networks of motoneurons using ISMS requires a detailed understanding of ISMS-evoked outputs in addition to the known anatomical arrangement of motor neuron pools. The primary goal of the present study in healthy rats was to derive a three-dimensional topographic map of functional motor outputs from the lumbar spinal cord to hindlimb skeletal muscles as defined by ISMS and to determine the current requirements and response latencies. These data will inform the further development of spinal cord neuromodulatory devices by guiding the location of stimulating electrode placement in the lumbar spinal cord, as well as current requirements. Table 1 provides common abbreviations found within the text, figures, and/or captions along with any color-coding shown within the figures.
Table 1.
Common abbreviations found within the text, figures, and/or captions along with any color association shown within the figures.
| Full Word | Abbreviation | Color Association |
|---|---|---|
| Spinal Cord Injury | SCI | |
| Intraspinal Microstimulation | ISMS | |
| Brain-Computer-Spinal Cord | BCSC | |
| Electromyographic | EMG | |
| Lateral Gastrocnemius | LA | |
| Tibialis Anterior | TA | |
| Vastus Lateralis | VL | |
| Biceps Femoris | BF | |
| Stimulus-Triggered Averaging | StTA | |
| Hip Flexion | HF | Dark Blue |
| Hip Extension | HE | Blue |
| Knee Flexion | KF | Dark Green |
| Knee Extension | KE | Lime Green |
| Ankle Flexion | AF | Orange |
| Ankle Extension | AE | Light Orange |
| Digit Flexion | DF | Dark Red |
| Digit Extension | DE | Red |
| Leg Adduction | L-Ad | Pink |
| Leg Abduction | L-Ab | Light Pink |
| Trunk | TRK | Gray |
| Rostrocaudal | RC | |
| Mediolateral | ML | |
| Dorsoventral | DV |
Methods
Rationale for Rat Model
While all mammals have corticospinal connections (Nudo and Masterton 1990), and thus possess an anatomical substrate for cortical control of motor neuron output, the laboratory rat was chosen for this study because the anatomical connections of motor cortex to the spinal cord are well known (Imai and Aoki 1993, Hagg, Baker et al. 2005), allowing for a direct comparison to published research. As a result, we compare our derived topographical map of hindlimb motor representation to the anatomical representation of motor neuron pools located in the hindlimb spinal cord of the rat (Mohan, Tosolini et al. 2015). In addition, powering preclinical therapeutic studies with sufficient numbers of subjects is generally more feasible using rodent species. Furthermore, spinal cord contusions in rats result in a fluid filled cavity, which also occurs in humans. As in many other mammalian species, it is possible to create graded injury severities in rats with high reliability, and behavioral testing is relatively straightforward. While ultimately there may be a need for generalizing results to non-human primate species prior to clinical investigation, rodents provide a feasible model platform to achieve sufficient statistical power to test technological parameters and initial neurobiological hypotheses in the context of functional recovery studies.
Subjects
Nine, healthy, adult, Sprague Dawley rats were randomly selected for this study. Body weights ranged from 222 – 388 grams (mean = 297.8 ± 54.9 grams) and ages ranged from 49 – 89 days old. This study was performed in accordance with all standards in the Guide for the Care and Use of Laboratory Animals (Institute for Laboratory Animal Research, National Research Council, Washington, DC: National Academy Press, 1996). The protocol was approved by the University of Kansas Medical Center Institutional Animal Care and Use Committee.
After a stable anesthetic state was reached using isoflurane anesthesia, all procedures were performed under initial ketamine hydrochloride (100 mg/kg; IP)/xylene (5 mg/kg; IP) anesthesia. Anesthesia was maintained with subsequent doses of ketamine (0.1 mL; IP or IM) and monitored via pinch and corneal responses. Additional doses of ketamine were administered if the rat reacted to a pinch of the forepaw/hindpaw or blinked after lightly touching the cornea.
EMG Electrode Implantation
EMG electrodes were implanted in four hindlimb muscles: the lateral gastrocnemius (LG), tibialis anterior (TA), vastus lateralis (VL), and biceps femoris (BF). Each EMG electrode consisted of a pair of insulated multi-stranded stainless steel wires exposed approximately 1 mm, with the exposed, implanted end of the wire folded back on itself (“hook” electrode). Implantation locations were determined by surface palpation of the skin and underlying musculature. Once the hindlimbs were shaved, EMG electrodes were inserted into the belly of each muscle with the aid of a 22 gauge hypodermic needle. For each EMG electrode pair, the wires were positioned approximately 5 mm apart in each muscle. The external portion of the wires was secured to the skin with surgical glue (3M Vetbond Tissue Adhesive, St. Paul, MN) and adhesive tape. An additional ground lead was placed into the base of the tail.
EMG Location Verification
To verify that the EMG electrodes were within the belly of the muscle, a stimulus isolator (BAK Electronics, Inc., Umatilla, FL) was used to deliver a biphasic (cathodic-leading) square-wave current pulse to the muscle through the implanted EMG electrodes. In addition, the impedance between the EMG electrodes was tested via an electrode impedance tester (BAK Electronics, Inc., Umatilla, FL). The EMG electrodes were determined to be inserted properly and within the desired muscle if: a) the electrode impedance was approximately 7 – 8 kΩ; b) direct current delivery to the muscle resulted in contraction of the desired muscle, and c) the movement threshold was ≤ 5 mA.
Spinal Cord Exposure
Following initial anesthesia and shaving of the back, rats were placed on a constant dose of 1% isoflurane in 50% oxygen and 50% nitrous oxide anesthesia during the spinal exposure and spinal laminectomy. Body temperature was maintained using a homeothermic heating pad (Harvard Apparatus, Holliston, MA). A midline incision was made over the skin of the back, exposing the T12-L2 vertebrae. A laminectomy was performed on the T13-L1 vertebrae exposing the L2 - S1 segments of the spinal cord. The origin of the L2 dorsal root is located in the caudal T12 vertebral section (Gelderd and Chopin 1977, Padmanabhan and Singh 1979). As a result, the caudal end of the T12 vertebral bone was removed in order to locate the L2 dorsal root. The origin of the L2 dorsal root was used as a rostrocaudal reference (0.0 mm) for map reconstruction purposes. By using fine forceps and small scissors, the dura mater was removed to allow electrode penetration, and then isoflurane inhalation anesthesia was discontinued. Additional doses of ketamine were then initiated and administered periodically to maintain a stable anesthetic state through the remainder of the procedure. ISMS procedures were not initiated for at least 1–2 hours following the cessation of inhalant anesthetics. Animals were stabilized with a custom rodent spinal fixation frame (Keck Center for Collaborative Neuroscience Rutgers, The State University of New Jersey, USA) attached to the dorsal processes of vertebral segments T12 and L2.
Intraspinal Penetration Grid Strategy
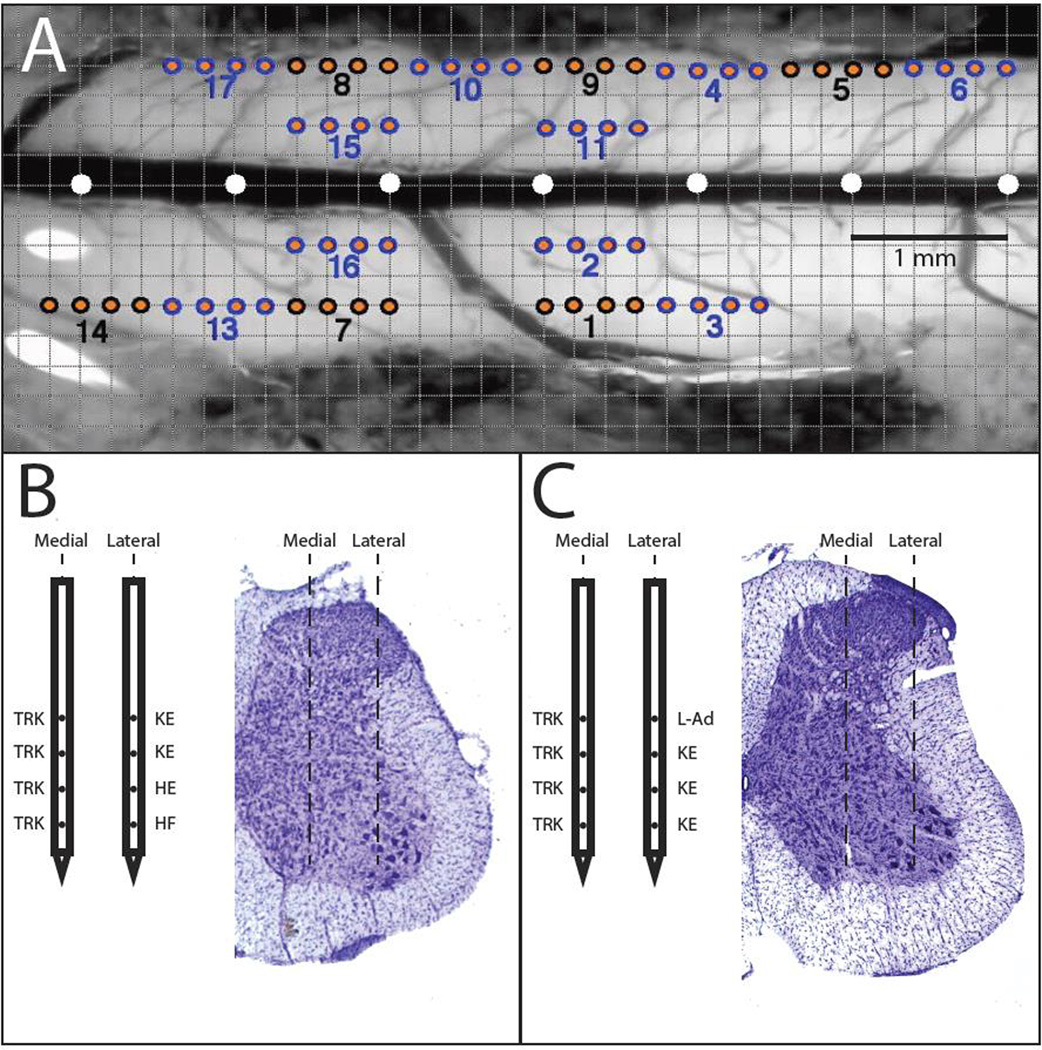
Warm, medical grade sterile silicone oil (50% Medical Silicone Fluid 12,500, 50% MDM Silicone Fluid 1000, Applied Silicone Corporation, Santa Paula, CA) was applied to the exposed spinal cord to prevent desiccation during the experiment. A magnified digital color photograph of the exposed spinal cord was taken through a surgical microscope. The image was transferred to Adobe Photoshop where it was cropped, resized, and enhanced with a green filter and converted to black and white. The image was then transferred to Canvas 3.5 where a 200 µm grid was superimposed, by calibration with a millimeter ruler, to indicate intended sites for microelectrode penetration. The 0.0 mm rostral-caudal reference was defined as the location of the L2 dorsal root located at the base of T12. Each electrode penetration was noted with an orange dot with a black or blue border and consecutive insertion numbers. In the example grid in Figure 1A, each penetration is symbolized by four dots of the same color to represent the four inserted shanks of the electrode. Penetration sites that were adjacent to each other were denoted by the different colors, either black or blue.
Figure 1. Overview of Microelectrode Stimulation Sites within the Spinal Cord.
A) Dorsal view of the surface of hindlimb spinal cord in a representative rat. A 0.2 mm grid was superimposed on a digital photomicrograph of the exposed cord. The position of electrode penetration was matched across subjects by the position of the L2 dorsal root (scene under the surgical microscope) and the central blood vessel (or midline). The distance between white circles is 1 mm. Four-shank microelectrodes were used; hence, insertion sites are grouped in sets of fours, indicated by similar colors (blue/orange or black/orange). Each number below the dots represents the insertion number. B and C) Representative ISMS-evoked movements from each of the four sites along the shank in a medial and lateral track with the corresponding histological cross-section. B) and C) are from different rats.
Intraspinal Electrode Insertion and Mapping
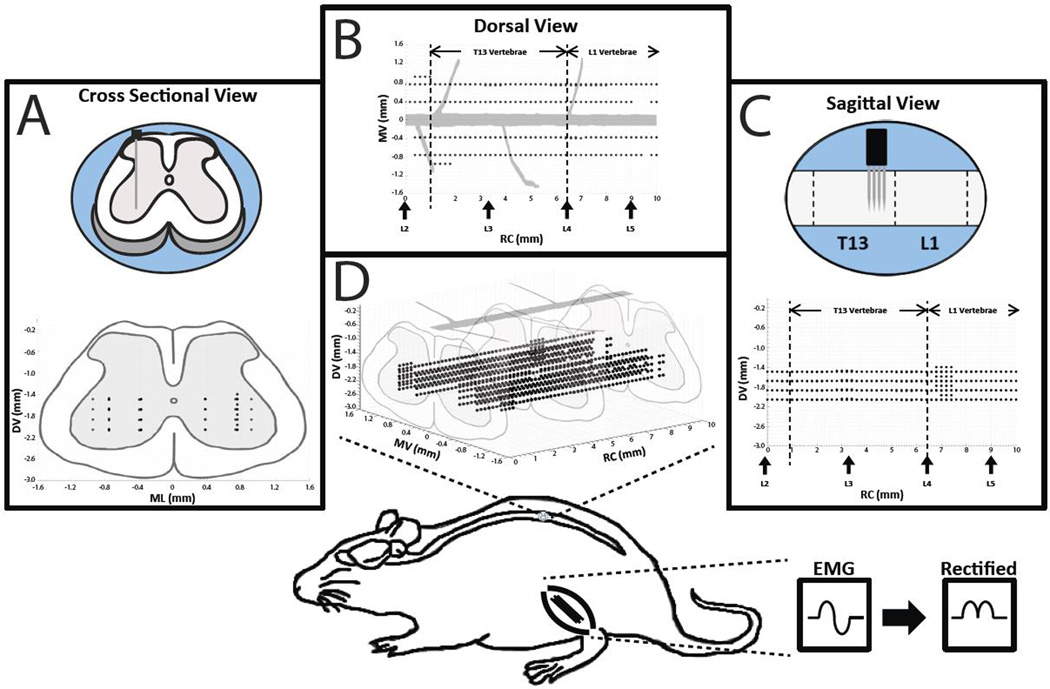
Additional doses of ketamine were given as needed to maintain a steady state of anesthesia and to eliminate spontaneous movements during the stimulation mapping and EMG recording sessions. Stimuli were delivered individually to each of 16 sites on a 4-shank Neuronexus (Neuronexus, Ann Arbor MI) probe positioned at regularly spaced sites, 0.2 mm, in dorsoventral tracks of the lumbar cord (testing one site location at a time). Shanks were separated 200 µm apart, and each shank had four 40 µm diameter stimulation sites that were separated 200 µm apart. Each stimulation site had an impedance in the range of ~30–40 kΩ at 1 kHz. The maximum compliance voltage of the stimulating system was 24V. Electrode depth was controlled using a Kopf hydraulic microdrive (Kopf Instruments, Tujunga CA). To explore the majority of the exposed spinal cord containing motor neurons innervating hindlimb muscles, electrodes were advanced rostrocaudally and mediolaterally using a Kopf micropositioner (Kopf Instruments, Tujunga CA). Stimulation sites were positioned within rostrocaudal, mediolateral, and dorsoventral coordinates (or tracts) derived from the L2 dorsal root, middle blood vessel, and the surface of the spinal cord (Figure 2). The locations of the dorsal roots and vertebral spinal segments were observed under the surgical microscope and compared to published anatomical data (Gelderd and Chopin 1977, Padmanabhan and Singh 1979). The locations were similar in each rat and matched the published records. As a result, variability between the respective spinal and vertebral locations appeared to be minimal.
Figure 2. Overview of Experimental Design.
Intraspinal microstimulation was conducted in the T13-L1 vertebral segments (L2-S1 spinal segments) in nine rats. Stimulation sites (black dots) were located in rostrocaudal (RC; 0 – 10 mm from the L2 nerve root), mediolateral (ML; 0.4 and 0.8 mm from midline), and dorsoventral (DV; 1.6 – 2.2 mm below the surface of the spinal cord) dimensions. A) A cross sectional view of the rat spinal cord showing the dorsoventral (DV) and mediolateral (ML) locations of the stimulation sites while collapsing the rostrocaudal (RC) locations. B) A dorsal view of the rat spinal cord showing the ML and RC locations of the stimulation sites while collapsing the DV locations. Vertical arrows on the x-axis indicate the approximate locations of the dorsal roots. C) A sagittal view of the rat spinal cord showing the DV and RC locations of the stimulation sites while collapsing the ML locations. D) The three dimensional topographic map derived from the cross sectional, dorsal, and sagittal views. In one rat, stimulation sites were explored in a third ML track (1.0 mm from midline). Bottom: Location of the lumbar cord examined in the rat. In three rats, EMG signals from selected hindlimb muscles were recorded during ISMS, filtered, full-wave rectified, and averaged during each stimulation trial.
Stimulation Current Description
Initial stimulation rates followed those from published materials (Bamford, Putman et al. 2005, Moritz, Lucas et al. 2007). Stimuli consisted of trains of three biphasic (cathodic-leading) pulses with 0.2-ms square-wave durations delivered at 300 Hz. Stimulus trains were separated by 1 second. Subsequently, current intensity was increased in 1 µA increments not exceeding 80 µA until a consistent movement was evoked with every stimulus train. The lowest stimulation current that evoked a visible and consistent joint displacement was defined as the movement threshold (Frost, Iliakova et al. 2013).
Description of Evoked Movements
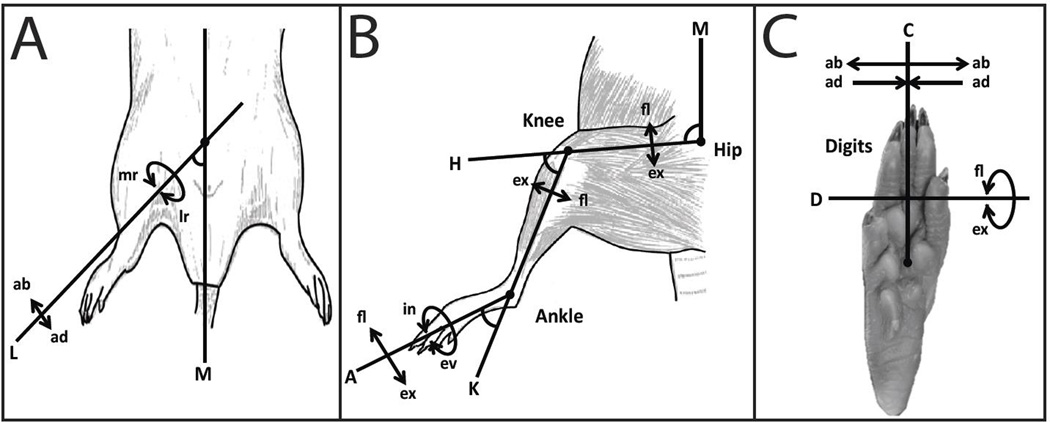
For each stimulation site, the movement observed was carefully described with the aid of movement diagrams (Gould III, Cusick et al. 1986). The observed movements were described hierarchically, first by either joint or whole leg movement. If the movement was restricted to a specific joint, it subsequently was categorized as a hip, knee, ankle, or digit movement. Then the movement was categorized as flexion (fl), extension (ex), inversion (in), eversion (ev), abduction (ab), or adduction (ad). If the movement was classified as a whole leg movement, the only descriptive terms recorded were abduction, adduction, medial rotation (mr), or lateral rotation (lr).
Whole leg movements were classified by the leg axis (L) and the intersecting midline axis (M) (Figure 3A). Whole leg movements usually involved movement at the hip joint with the addition of multiple hindlimb muscle activation thus creating a movement of the entire hindlimb instead of a specific joint movement. Leg abduction (ab) was classified as the increase in angle between axis L and axis M while leg adduction (ad) was classified as the decrease in angle between axis L and axis M. Medial rotation (mr) and lateral rotation (lr) were classified as the rotation of the entire leg, axis L, at the hip joint.
Figure 3. ISMS-Evoked Movement Classification.
Movements (arrows) elicited by ISMS relative to anatomical axes. A) Whole leg movements elicited by ISMS. B) Single joint movements at the hip, knee, and ankle elicited by ISMS. C) Digit movements elicited by ISMS. Axis Classification: A = Ankle Axis, K = Knee Axis, H = Hip Axis, M = Midline Axis, D = Digit Axis, C = Capitate Axis, and L = Leg Axis. Movement Classification: fl = flexion, ex = extension, in = inversion, ev = eversion, ab = abduction, ad = adduction, mr = medial rotation of the leg, and lr = lateral rotation of the leg.
Hip movements were classified by the hip axis (H) and intersecting midline axis (M) (Figure 3B). The H axis was the axis in motion with the M axis remaining rigid. Hip flexion was classified as the decrease in angle between the H and M axis while hip extension was classified as the increase in angle between the H and M axis. The knee movements were classified by the knee axis (K) and intersecting H axis (Figure 3B). The K axis was the axis in motion with the H axis remaining rigid. Knee flexion was classified as the increase in angle between the K and H axis while knee extension was classified as the decrease in angle between the K and H axis. The ankle movements were classified by the ankle axis (A) and the K axis (Figure 3B). The A axis was the axis in motion with the K axis remaining rigid. Ankle flexion was classified as the increase in angle between the A and K axis while ankle extension was classified as the decrease in angle between the A and K axis. For convenience and simplicity, ankle eversion (ev) and inversion (in) were referred to with respect to the rotation axis A at the ankle joint.
Digit movements were classified by the digit axis (D) and capitate axis (C) (Figure 3C). Digit flexion was classified as the curling of the metatarsals around axis D while digit extension was classified as the uncurling of the metatarsals around axis D. Digit abduction (ab) was classified as the spread or movement away from axis C while digit adduction (ad) was classified as the closing or movement towards axis C.
Stimulus-Triggered Average (StTA) of EMG
Using custom software (Matlab; The Mathworks, Inc., Natick, Massachusetts, United States), StTAs of rectified EMG of all recorded leg muscle EMGs were constructed to determine muscle activation (Hudson, Griffin et al. 2015). For each of the implanted muscles, EMG data were recorded for at least 10 stimulus trains (defined above) at movement threshold to obtain StTAs and averaged over a set time window of 220 ms. StTAs were aligned with the time of the first stimulus (i.e., 0 ms) and included data from −20.2 to +199.8 ms relative to the time of the first stimulus. A muscle was considered active when the average rectified EMG reached a peak ≥ 2.25 SD above baseline values in the interval from −20.2 to 0 ms and had a total duration of ≥ 3 ms. The stimulus artifact was minimal to absent in EMG recordings with no muscle activation. If an artifact was observed, the amplitude of the artifact was minimal compared to the amplitude of the evoked movement; however, the averaging of the StTA of EMG recordings largely eliminated the stimulus artifact. As a result, the stimulus artifact was determined to have minimal to no effect on the recordings. ISMS-evoked EMG potentials were high-and low-pass filtered (30 Hz to 2.5 kHz), amplified 200- to 1,000 fold, digitized at 5 kHz, rectified and recorded on an RX-8 multi-channel processor (Tucker-Davis Technology, Alachua FI). While a separate 60 Hz notch filter was not used, 60 Hz noise was not evident in the individual traces, and any low-level 60 Hz signals were effectively cancelled via signal averaging. During each experiment, the EMG signals were stored and analyzed offline.
Tissue Processing
In three rats, at the conclusion of the physiological procedures, electrolytic lesions were created at selected spinal cord locations by delivering direct current at 100 µA for 60 seconds. Also, cresyl violet injections were made at various levels of the cord to provide additional fiducial markers. At the conclusion of each experiment, animals were euthanized with an intraperitoneal injection of beuthanasia (100 mg/kg) and perfused with 4% paraformaldehyde in 0.1 M PBS. The spinal cord was sectioned at 40 µm on a sliding microtome in the coronal plane. Histology was performed on selected sections with cresyl violet stain for Nissl bodies at specific column intervals.
Results
Movements Evoked by ISMS and Relationship to Microelectrode Track Locations
In the nine rats used in this study, a total of 1882 sites were stimulated using microelectrode arrays within comparable rostrocaudal, mediolateral, and dorsoventral penetration tracks across the exposed spinal cord (caudal T12 to caudal L1 vertebral segments; Figure 1A). The rostrocaudal tracks began at the entry of the L2 dorsal root (0 mm mark rostrocaudally) located in the caudal T12 vertebral segment and extended caudally in 0.2 mm increments for 10 mm, ending in the caudal L1 vertebral segment. Movements were evoked in 99.9%, or all but two of the 1882 sites. Evoked movements were limited to single joint movements, whole leg movements, and trunk movements and were categorized accordingly (Figure 3). The proportion of individual movement categories, from highest to lowest, was as follows: trunk (30.39%), leg adduction (13.97%), knee flexion (9.35%), hip extension (8.24%), hip flexion (7.23%), leg abduction (6.64%), ankle extension (6.27%), knee extension (5.42%), ankle flexion (4.84%), digit flexion (3.56%), and digit extension (1.28%). The remaining individual movement categories that each comprised < 1% of the total evoked movements (lateral/medial rotation of the ankle, digit adduction/abduction, single-digit movements) or that were unreliable (evoked in < 50% of train bursts), were not considered further. Thus, 97.2% of evoked movements were examined in the remainder of the analysis.
Distribution of microelectrode track locations on the surface of the exposed hindlimb spinal cord of one representative rat is shown in Figure 2A. The 0.2 mm superimposed grid allowed for an accurate comparison of stimulation sites between rats. Based on identification of microelectrode tracks in cresyl violet-stained sections, stimulation sites spanned intermediate to deep lamina of the spinal cord grey matter. Further, the most ventral microelectrode sites of the lateral track typically were located within lamina IX, i.e., within the vicinity of the motoneuron pool. Figures 1B and 1C show representative results of stimulating each of the four sites on medial and lateral microelectrode tracks in two different rats, respectively. While movements evoked along a single dorsoventral track were often identical (e.g., trunk movements at each of the four sites in the medial tracks of the two rats), it was not uncommon for different movements to be evoked along a single dorsoventral tract. For example, Figure 1B shows that knee extension was evoked from stimulation of the two dorsal sites, while hip extension and hip flexion were evoked at progressively more ventral sites.
Current Thresholds for ISMS-Evoked Movements
The average current required to evoke visibly reliable movements with ISMS (average threshold) was similar across the movement categories. The average threshold for all sites was 8.1 ± 5.5 µA with a minimum of 1 µA, a maximum of 36 µA, and a median of 6 µA. The average threshold for specific movement categories, from lowest to highest threshold, was as follows: leg abduction = 6.3 ± 4.6 µA; knee extension = 6.9 ± 5.2 µA; knee flexion = 7.0 ± 5.5 µA; leg adduction = 7.0 ± 4.5 µA; hip flexion = 7.4 ± 6.2 µA; hip extension = 7.6 ± 4.0 µA; digit flexion = 7.7 ± 5.5 µA; digit extension = 7.8 ± 5.9 µA; ankle flexion = 8.3 ± 5.7 µA; ankle extension = 9.4 ± 6.8 µA; trunk = 10.0 ± 5.6 µA (Table 2).
Table 2.
The average threshold for specific movement categories are listed from lowest to highest threshold.
| Movement | Average Threshold (µA) |
|---|---|
| Leg Abduction | 6.3 ± 4.6 |
| Knee Extension | 6.9 ± 5.2 |
| Knee Flexion | 7.0 ± 5.5 |
| Leg Adduction | 7.0 ± 4.5 |
| Hip Flexion | 7.4 ± 6.2 |
| Hip Extension | 7.6 ± 4.0 |
| Digit Flexion | 7.7 ± 5.5 |
| Digit Extension | 7.8 ± 5.9 |
| Ankle Flexion | 8.3 ± 5.7 |
| Ankle Extension | 9.4 ± 6.8 |
| Trunk | 10.0 ± 5.6 |
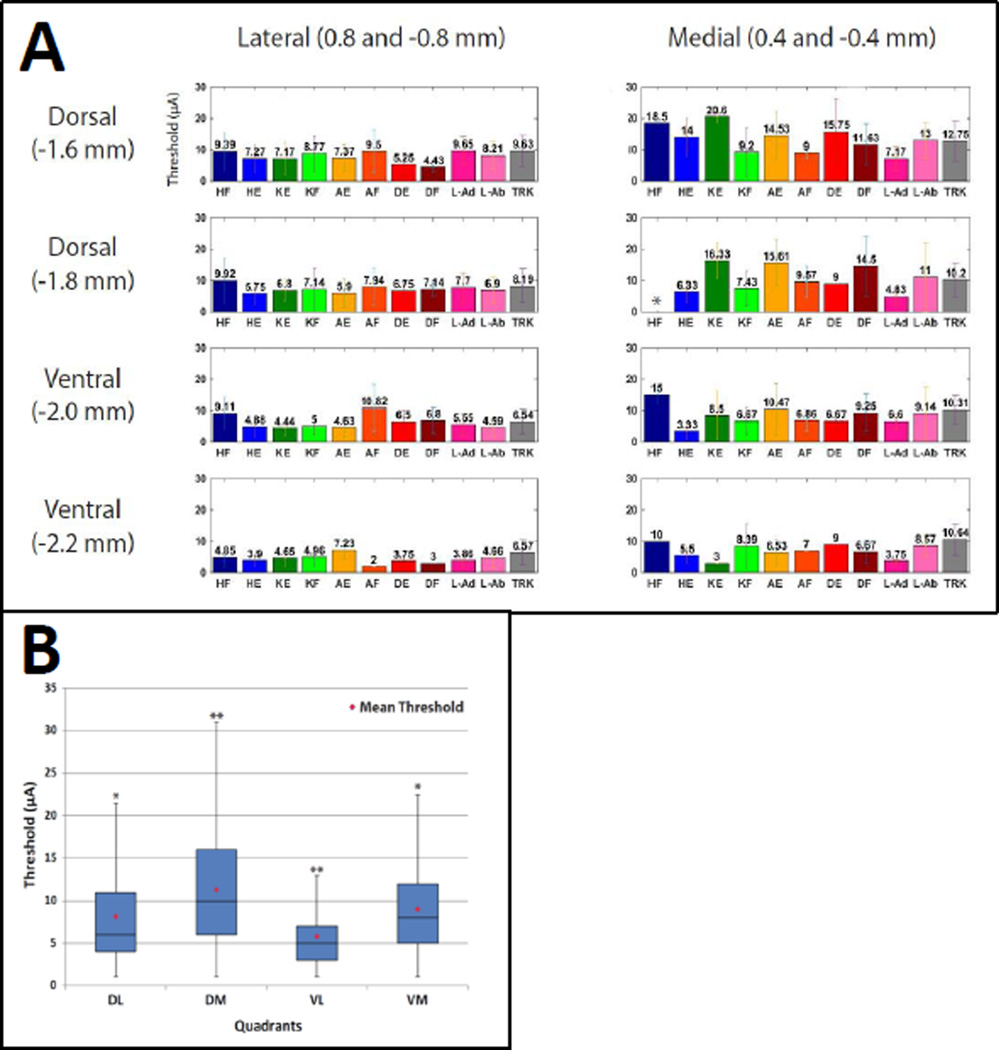
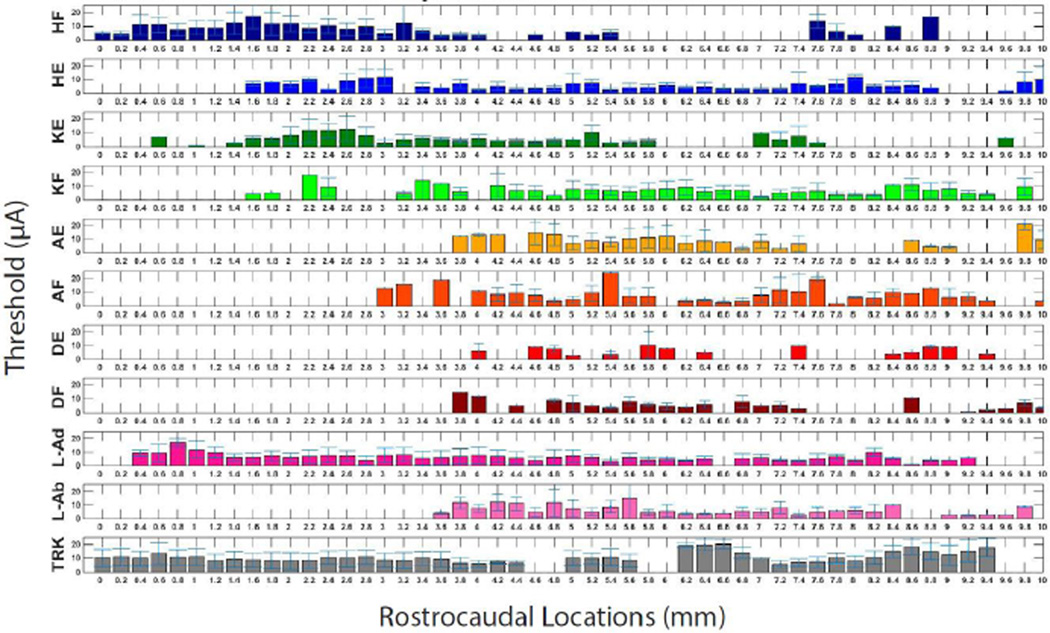
Figure 4A shows the average threshold for each movement category based on mediolateral and dorsoventral coordinates collapsed across rostrocaudal locations. For statistical analysis, the threshold data from various locations were divided into dorsomedial, dorsolateral, ventromedial, and ventrolateral quadrants (Figure 4B). A one-way ANOVA demonstrated that there was a significant effect of quadrant on current thresholds for evoking movements [F(3, 1862) = 83.32, p < 0.0001]; [F(Between Groups Degrees of Freedom, Within Groups Degrees of Freedom) = F value, probability of Type I error] . Post-hoc comparisons (Tukey’s HSD) showed that dorsomedial thresholds were significantly higher than each of the other three quadrants. Further, ventrolateral thresholds were significantly lower than each of the other three quadrants (p < 0.05). The average threshold showed no clear pattern of increase or decrease from the rostral tracks to the caudal tracks (Figure 5).
Figure 4. Average Thresholds Based on Mediolateral and Dorsoventral Location.
A) The average threshold (± SD) for each movement category is shown for each mediolateral and dorsoventral location. Average thresholds were significantly lower in lateral and ventral sites compared with medial and dorsal sites. * No hindlimb flexion movements were evoked at the indicated location. B) The average threshold for all movements is shown in a box and whisker plot for ML and DV tracks collapsed across four quadrants: dorsolateral (DL); dorsomedial (DM); ventrolateral (VL); ventromedial (VM). Post-hoc comparisons (Tukey’s HSD) showed that DM thresholds were significantly higher and VL thresholds were significantly lower than each of the other three quadrants. ** Significant difference from all quadrants (p < 0.0001). * Significant difference from DM and VL quadrants (p < 0.0001).
Figure 5. Average Thresholds by Rostrocaudal Location.
The average threshold (± SD) for each movement category is shown for each rostrocaudal (RC) location beginning at the L2 dorsal root (0 mm). There were no statistically significant differences between rostral and caudal locations.
Movement Topography
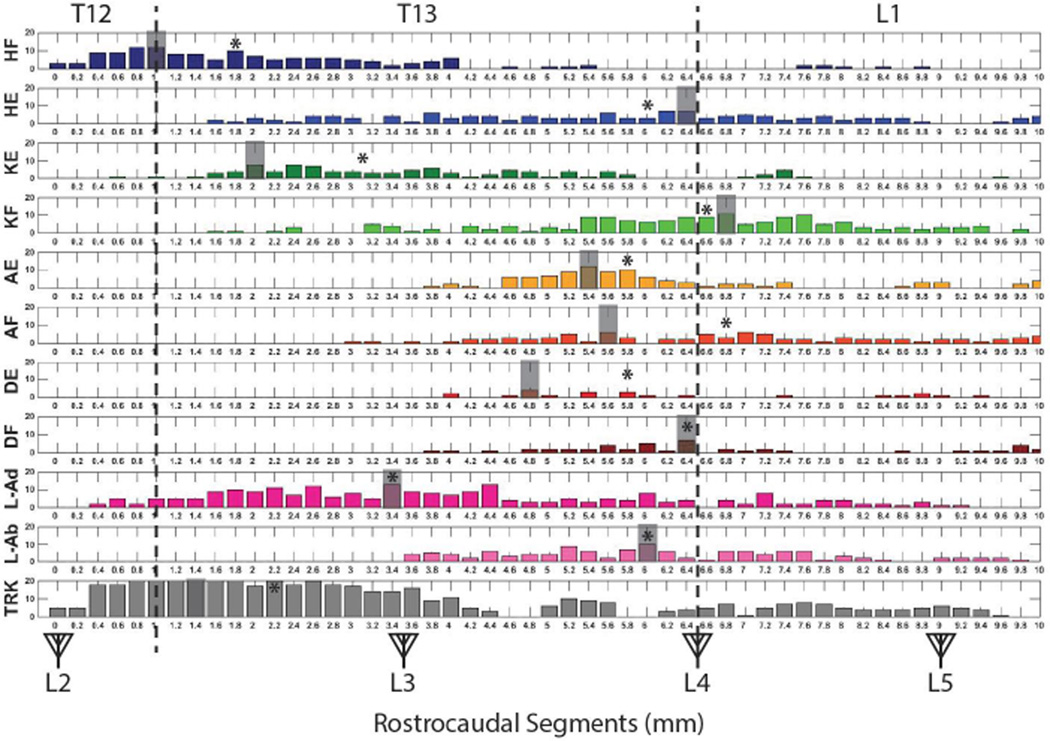
While there was considerable overlap in movement categories at a given location, clear trends were evident. To illustrate topography along the rostrocaudal length of the spinal cord segment under examination, the location of ISMS-evoked movement categories is shown in Figure 6. Starting at rostral locations (between L2 and L3 dorsal roots corresponding to vertebral segments caudal T12 to rostral T13), proximal movements (hip, knee, leg, trunk) were usually evoked, but distal movements (ankle, digit) were rarely evoked. Since some of these movements were represented at the most extreme rostral locations (e.g., hip flexion and trunk), it is possible that their representations extend even further rostral than the L2 dorsal root.
Figure 6. Rostrocaudal Distribution of ISMS-Evoked Movements.
The vertebral segments (caudal T12 to rostral L2) are displayed on the top of the figure while the spinal segments (L2 to S1) are displayed with triangles representing dorsal roots on the bottom of the figure. The vertical dashed lines represent the vertebral junctions. Antagonist movements for each of the proximal body parts appear to be quite disparate in rostrocaudal position. The shaded segment represents the mode of each recorded ISMS-evoked movement. * = the median of each recorded ISMS-evoked movement.
Many of the individual movement categories, especially proximal movement categories, were represented over long rostrocaudal distances. Thus, trends were seen more clearly by highlighting the modal position of each movement category (assuming a Gaussian distribution), shown as a shaded segment in Figure 6. For proximal movements, the modal positions of antagonist movements were widely disparate. For example, the mode for hip flexion was at the T12/T13 vertebral junction, while the mode for hip extension was substantially more caudal, at the T13/L1 junction. Likewise, knee extension was located 1 mm caudal to the T12/T13 junction, while knee flexion was located at approximately the T13/L1 junction. Leg adduction was located at approximately the L3 dorsal root, while leg abduction was more caudal near the L4 dorsal root. Distal movements tended to be more restricted in their distribution. The modal positions of antagonist distal movements also were in more similar locations. For example, ankle extension and flexion were located at approximately the same rostrocaudal position about 1 mm rostral to the L4 dorsal root. Digit extension was located about 1.5 mm anterior to the L4 dorsal root, while digit flexion was very close to the L4 dorsal root. Similar disparities in antagonist movements were evident when the median position was examined (asterisks in Figure 6). In general, despite a more rostral modal and median position for hip flexion, knee extension, and trunk, each of the hindlimb movements could be evoked from at least some sites between L3 and L4 dorsal roots.
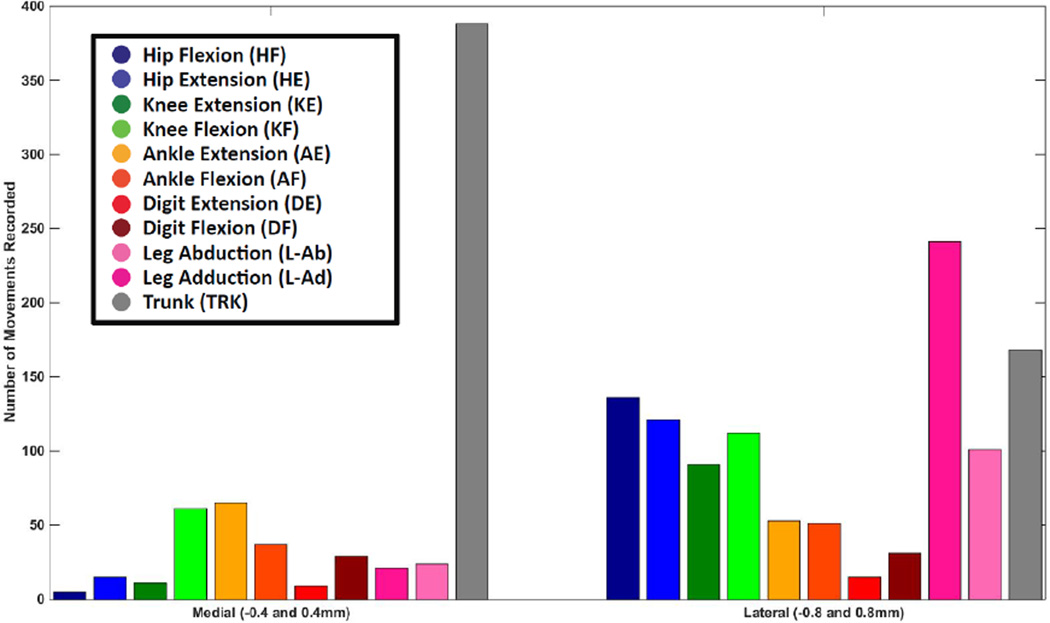
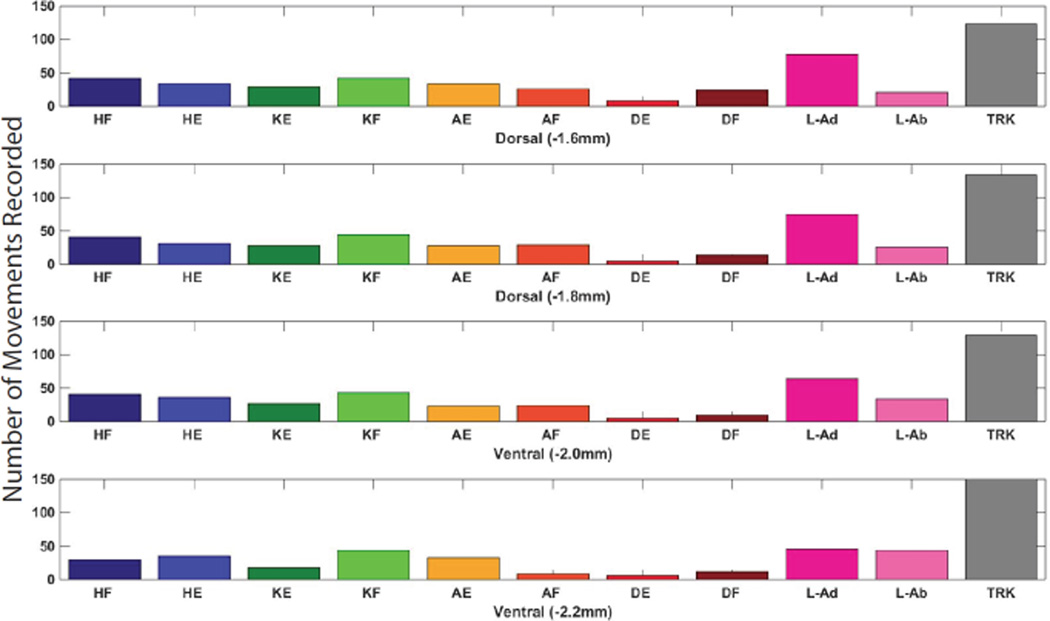
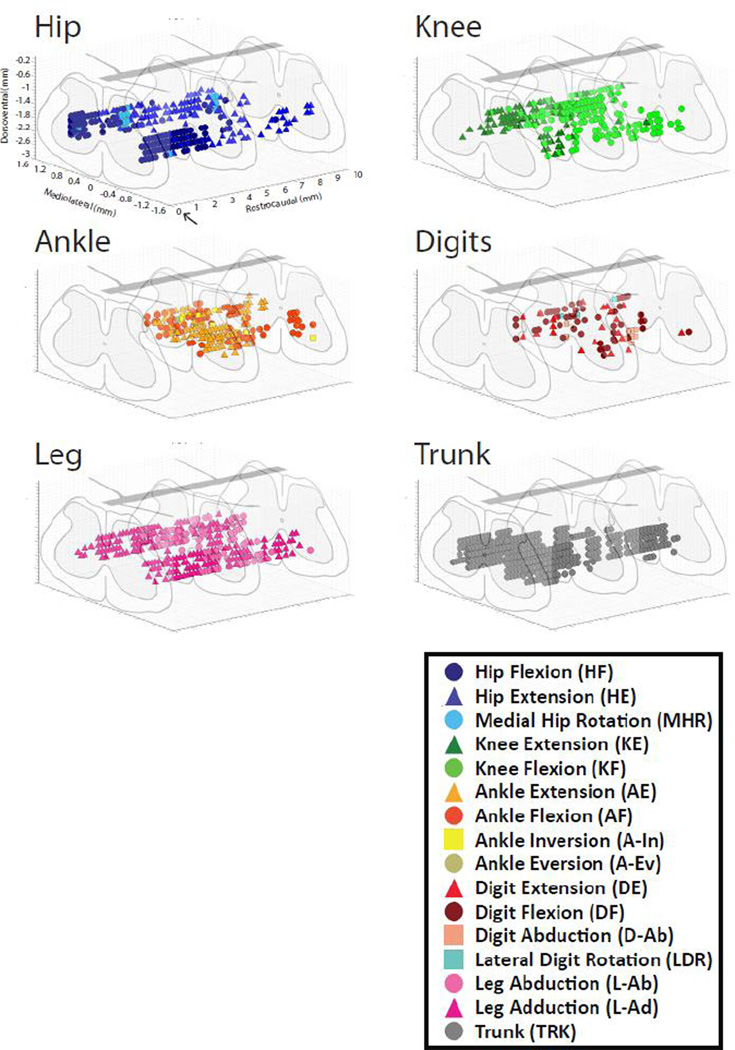
The distribution of movement categories between medial and lateral tracks is shown in Figure 7. Trunk movements were most common at medial locations, while a wider variety of movements was observed in lateral tracks. Although all trunk movements were categorized together, it was noted that as stimulation sites moved more caudal in the spinal cord the evoked trunk movements included more caudal muscles. In the caudal L1 vertebrae, tail movements were often evoked. There was no obvious difference in movements evoked at different dorsoventral positions within the spinal cord (Figure 8). A three-dimensional representation of hindlimb movements evoked by ISMS is illustrated in Figure 9.
Figure 7. Mediolateral Distribution of ISMS-Evoked Movements.
The number of movements recorded at each of the two mediolateral positions is shown. Data derived from both side of the cord were grouped together. Trunk movements were most common in medial tracks while a wider variety of movements were evoked in lateral tracks.
Figure 8. Dorsoventral Distribution of ISMS-Evoked Movements.
The number of movements evoked at each of the four dorsoventral depths. There was no clear difference between movements evoked at different dorsoventral levels.
Figure 9. Three-dimensional topographic maps of the location of evoked trunk and hindlimb movements.
Rostrocaudal locations began at the L2 dorsal root (arrow) located at caudal T12 vertebrae and expanded 10 mm caudally. Dorsoventral locations ranged from approximately 1.6 to 2.2 mm. Mediolateral tracks were located at 0.4 and 0.8 mm from midline.
ISMS-Evoked EMG
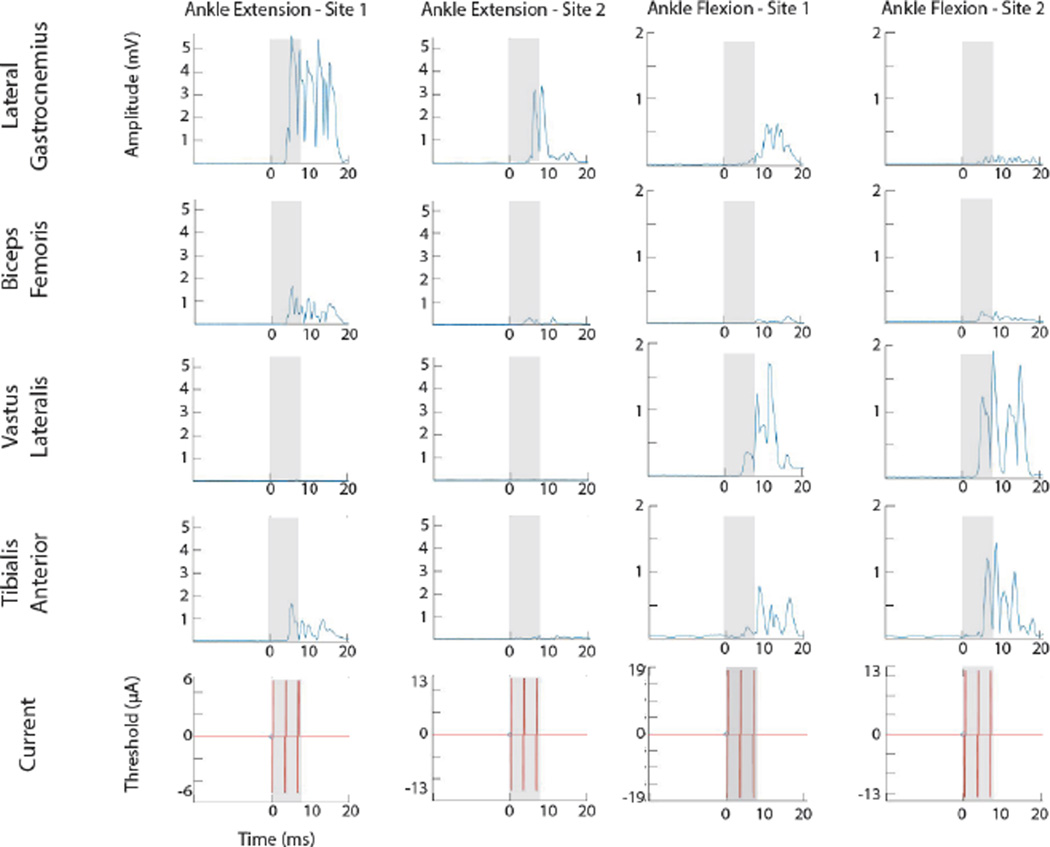
EMG recordings from four hindlimb muscles were obtained during hip, knee, and ankle movements in three rats. A total of 28 ISMS-evoked movements, corresponding to 112 recorded muscles, were recorded during this study. Stimulus-triggered averages (StTAs) of EMG activity at stimulation threshold were used to determine which muscles were active for each recorded movement type (Hudson, Griffin et al. 2015). Figure 10 shows representative EMG recordings during ISMS evoked flexion or extension movements of the ankle at 4 individual stimulation sites. The shaded area indicates the time period of stimulation. During ankle extension, the lateral gastrocnemius was clearly the dominant, activated muscle at both electrode sites. At Site 1, there was minor activation of the biceps femoris and tibialis anterior. During ankle flexion, the tibialis anterior and vastus lateralis were clearly the dominant, activated muscles. In ankle flexion – Site 1, there was minor activation of the lateral gastrocnemius.
Figure 10. Stimulus-triggered averages (StTAs) of EMG activity during ankle flexion and extension.
StTAs of 4 muscles of the hindlimb from 4 sites in the lumbar enlargement of the spinal cord. Time of triggered events are listed at the bottom of each stimulus graph. Stimulus occurs at time 0 ms. The gray box indicates the time of stimulation. EMG electrodes were inserted and recorded from four hindlimb muscles: Lateral Gastrocnemius (LG), Biceps Femoris (BF), Vastus Lateralis (VL), and Tibialis Anterior (TA).
Of the 28 ISMS-evoked movements (i.e., 112 muscles) recorded, a total of 87 muscles were considered activated during ISMS. For all 87 muscles, the average latency (i.e., time from onset stimulation to onset EMG activity) was 4.0 ± 0.7 ms. The average latency for individually activated muscles, from lowest to highest, was as follows: biceps femoris = 3.7 ± 0.5 ms; vastus lateralis = 3.9 ± 0.9 ms; lateral gastrocnemius = 4.2 ± 0.5 ms; tibialis anterior = 4.4 ± 0.8 ms.
Comparison to Anatomical Distribution of Motor Neuron Pools
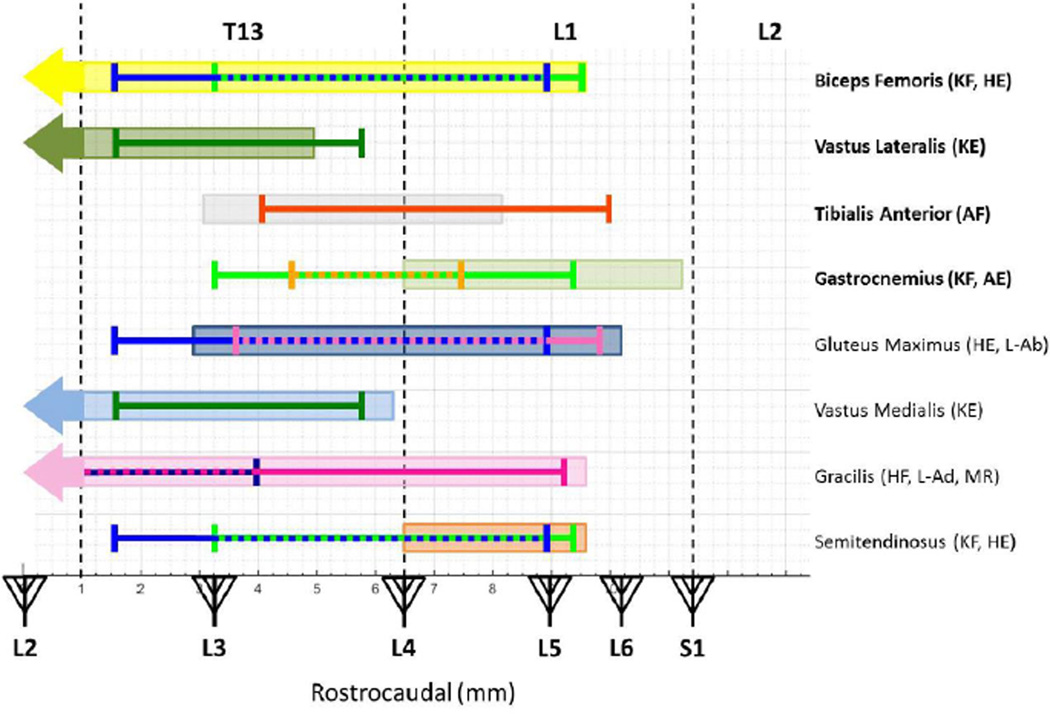
To better understand whether ISMS evoked movements and EMG are related to the anatomical distribution of motor neuron pools, we superimposed the distribution of ISMS-evoked movements from the present data onto the segmental distribution of the motor neuron columns that supply the rat hindlimb muscles based on an anatomical study by Mohan et al. (Figure 11) (Mohan, Tosolini et al. 2015). To narrow the rostrocaudal area of interest, the rostrocaudal range was truncated (e.g., outliers removed from Figure 6), which contained at least 83% of the data after truncation. Superimposing the physiological and anatomical data sets demonstrates a close correspondence. By comparing the four muscles recorded in this study (bolded in Figure 11), there is obvious overlap of the recorded movement area and the layout of the motor neuron columns (shaded boxes). Excluding the vastus lateralis and tibialis anterior, recorded muscle movements did not extend caudally past the recorded motor neuron columns; however, several movement recordings do extend rostrally past the recorded motor neuron columns.
Figure 11. Relationship of ISMS-evoked Movement Topography to Motor Neuron Pool Distribution.
The rostrocaudal range of ISMS-evoked movements was superimposed over the location of motor neuron pools (shaded boxes) for specific muscles based on published neuroanatomical data (Mohan, Tosolini et al. 2015). In order to narrow the rostrocaudal region of interest, the rostrocaudal range was truncated to remove outliers, which contained no less than 83% of the data after truncation. The vertebral segments (caudal T12 to rostral L2) are displayed on the top of the figure while the spinal segments (L2 to S1) are displayed with triangles representing dorsal roots on the bottom of the figure. The vertical dashed lines represent the vertebral junctions. The bolded muscles are the muscles from which EMG electrodes were implanted in this study. HE = Hip Extension, HF = Hip Flexion, KE = Knee Extension, KF = Knee Flexion, AE = Ankle Extension, AF = Ankle Flexion, L-Ab = Leg Abduction, L-Ad = Leg Adduction, and MR = Medial Rotation.
In Figure 11, we noted the overlap in the rostrocaudal direction between the evoked movement and the expected muscles that would be activated during the respective movement. For example, the biceps femoris is expected to be active during knee flexion and hip extension. In Figure 11, the motor neuron columns for biceps femoris overlap with the recorded movements from mid-T13 to mid-L1 (3.2 – 8.8 mm). The vastus lateralis is expected to be active during knee extension. The motor neuron columns for vastus lateralis overlap with the recorded movement from rostral T13 to caudal T13 (1.6 – 5.0 mm). The tibialis anterior is expected to be active during ankle flexion. The motor neuron columns for ankle flexion overlap with the recorded movement from mid-T13 to rostral L1 (4 – 8.2 mm). The gastrocnemius is expected to be active during knee flexion and ankle extension. The motor neuron columns for gastrocnemius overlap with the recorded movements from the T13-L1 junction to rostral L1 (6.5 – 7.4 mm). The gluteus maximus is expected to be active during hip extension and leg abduction. The motor neuron columns for gluteus maximus overlap with the recorded movements from mid-T13 to mid-L1 (3.6 – 8.8 mm). The vastus medialis is expected to be active during knee extension. The motor neuron columns for vastus medialis overlap with the recording movement from rostral T13 to caudal T13 (1.6 – 5.8 mm). The gracilis is expected to be active during hip flexion, leg adduction, and medial rotation. Medial rotation was only recorded a few times during the study, so not enough movements were recorded to determine a sufficient range of movement. The motor neuron columns for gracilis overlap with the recorded movements from caudal T12 to mid-T13 (0 – 4 mm). The semitendinosus is expected to be active during knee flexion and hip extension. The motor neuron columns for semitendinosus overlap with the recorded movements from the T13-L1 junction to mid-L1 (6.5 – 8.8 mm).
Discussion
The primary goal of this study was to derive a three-dimensional topographic map of functional motor outputs from the lumbar spinal cord to hindlimb skeletal muscles as defined by ISMS. While there was considerable overlap in movement categories at a given location, clear trends were evident. Additionally, EMG recordings showed that multiple muscles were commonly coactivated by ISMS (Figure 10), demonstrating the possibility of evoking a range of specific and synergistic hindlimb movements that could be useful in the development of limb reanimation techniques for SCI patients.
Movements Evoked by ISMS and Relationships to Microelectrode Track Locations
There are various factors that hinder the ability to construct a complete topographic map, including: 1) location of blood vessels on the surface of the spinal cord, 2) duration of surgery and neurophysiological data collection, and 3) cumulative amount of ketamine administered, which varied between subjects. Thus, while a substantial amount of data was collected in each rat, the three-dimensional topographic map is a composite based on all animals in the study. To determine topographic trends within the spinal cord, all stimulation sites were overlaid (i.e., superimposed) as shown in Figure 2. Since the stimulation grid was positioned using the L2 dorsal root (rostrocaudal coordinates), the central blood vessel (mediolateral coordinates), and the surface of the spinal cord (dorsoventral coordinates), the stimulation grid across all rats can be considered accurate for superimposing maps from multiple subjects. Post-mortem histology of the rat spinal cord allowed comparison of the stimulation sites in each electrode penetration to the location of motor neurons in the ventral horn (Figure 1).
Although there were clear evoked-movement trends in the rostrocaudal and mediolateral tracks, there was still variability within each track. For example, Figure 1B and 1C shows the variability dorsoventrally along the lateral track at the same stimulation sites across two rats. This suggests that a multi-site intraspinal stimulating electrode array is advantageous for stimulation within the spinal cord, as one movement does not dominate dorsoventrally and/or mediolaterally within the spinal cord. This trend agrees with the findings of Sunshine, et. al. when using ISMS to evoke movements within the cervical spinal cord (Sunshine, Cho et al. 2013).
Current Thresholds for ISMS-Evoked Movements
In many proposed neuroprosthetic applications that use spinal cord stimulation, one important goal is to use the lowest possible current intensity that will produce the desired response. Low current intensity has practical advantages such as minimization of tissue damage, as well as a longer operating lifespan for battery-powered devices. From a neurophysiological perspective, low current intensities result in minimal volume conduction providing greater selectivity in the activation of specific motor neuron pools.
The current required to evoke a visible muscle twitch via spinal cord stimulation can vary considerably as a function of several experimental parameters, such as electrode configuration, stimulation parameters, anesthetic state of the animal and animal species. We have limited the present discussion to spinal cord stimulation studies in rats, for comparable evaluation of parameters. Epidural spinal cord stimulation generally requires currents in the milliamp range to evoke movements, though some electrode configurations have resulted in evoked muscle contraction with current intensities as low as 500 µA (Alam, Garcia-Alias et al. 2015) or fall within a range of 50 – 300 µA (Wenger, Moraud et al. 2016). Thus, while under some conditions, evoked movements can be generated using epidural stimulation with currents as low as 50 µA, ISMS can elicit movements with substantially lower currents.
In general, ISMS can produce movements with at least an order of magnitude lower current intensity when compared to epidural stimulation. In the present study (using Neuronexus probes in ketamine-anesthetized rats; 40 µm diameter sites; iridium site activation; 30–40 kΩ impedance; three-pulse biphasic trains of 0.2-ms pulses delivered at 300 Hz), the average current intensity required to evoke visible movements via ISMS was about 8 µA. For ISMS electrode sites in the ventrolateral quadrant (i.e., in the vicinity of the motor neurons) the average threshold was only ~ 5 µA. Thus, the required current was as low, or lower, than other ISMS studies in rat spinal cord. For example, in the rat cervical cord, Sunshine et al. reported current thresholds of about 50 µA using tungsten microelectrodes with 800-1kΩ impedance (Sunshine, Cho et al. 2013). Bamford, et. al. reported an average current movement threshold of 8–12 µA using Teflon-insulated microwires (30 µm diameter; impedance not specified) for ISMS in the anesthetized rat lumbosacral spinal cord, (Bamford, Putman et al. 2005). Finally, Tresch, et. al., were able to generate isometric force maps at current levels between 2 and 15 µA using stainless steel microwire electrodes with < 1µm exposed tips and 10 MΩ impedance, however, the maximum compliance voltage for such high-impedance electrodes was 180V. Taken together with the present study, spatially specific ISMS can be achieved with very low current intensity and compliance voltages using iridium activated probes with small site area. These results are important in the development of potential implantable neuroprosthetic systems, and except for optogenetic systems (Montgomery, Yeh et al. 2015), may represent the lower limits of specificity using current ISMS technology.
Movement Topography
While numerous studies have been performed using ISMS to evoke forelimb movements from the cervical enlargement (Kasten, Sunshine et al. 2013, Sunshine, Cho et al. 2013), relatively few have focused on the lumbar enlargement. This may be due to the desire of quadriplegics to regain use of their upper extremities (i.e., fine hand and digit movements) which may have the greatest impact on their quality of life (Anderson 2004). Several studies have focused on epidural stimulation of the lumbar spinal cord in an effort to restore some function in the hindlimbs of human SCI patients (Harkema, Gerasimenko et al. 2011, Angeli, Edgerton et al. 2014, Sayenko, Angeli et al. 2014, Rejc, Angeli et al. 2015). Recently, the use of ISMS attracted attention due to lower current intensities for evoking movement as reviewed above (Bamford, Putman et al. 2005). In more recent studies of ISMS, Kasten et al. reported that rats receiving chronic therapeutic ISMS performed significantly better in behavioral tasks than unstimulated rats. Thresholds for movement did increase over time, but chronically stimulated ISMS electrodes showed no additional tissue damage produced by the electrical stimulation as compared to chronically unstimulated ISMS electrodes (Kasten, Sunshine et al. 2013).
Previous hindlimb motor maps derived via ISMS have consisted of maps of isometric force measured at the ankle (rat) (Tresch and Bizzi 1999) or maps with much lower spatial resolution (cat) (Mushahwar and Horch 2000), so a direct comparison cannot be made. However, the hindlimb motor map derived in rats in the present study has similarities to the overlapping movement representations observed in forelimb motor maps using similar techniques in rats (Sunshine, Cho et al. 2013). Sunshine et al. reported a significant overlap of evoked movements in the cervical enlargement, and extending beyond cervical motor neuron locations of the forelimb muscles. This is consistent with the findings in the present study. The hindlimb motor map revealed a significant overlap of evoked movements in the lumbar enlargement, but the range of each evoked movement extended beyond the lumbar motor neuron locations of the hindlimb muscles, suggesting that ISMS may also activate spinal interneurons and/or neighboring axons of passage, including spinal cord afferent fibers.
ISMS-Evoked EMG
For each movement, a subset of muscle groups was expected to be activated during specific movements. During ankle extension, the lateral gastrocnemius was expected to be activated, while during ankle flexion, the tibialis anterior was expected to be activated. From Figure 10, there are instances when the expected recorded muscle groups were activated, but other instances when they were not. Figure 10 shows examples of EMG recordings during ISMS-evoked ankle extension and flexion within two different stimulation sites for each movement. In some instances, only one or two recorded muscle(s) were activated, and during other instances, none of the recorded muscles were activated. In each instance, however, the same movement was evoked and recorded. That is, the same movement can be produced with different combinations of muscles.
Comparison to Anatomical Distribution of Motor Neuron Pools
ISMS within the rodent lumbar spinal cord evoked movements that were, to a large degree, predictable from the known rostrocaudal organization of motor neuron pools in the lumbar spinal cord. Figure 11 compares previously documented lumbar motor neuron locations in the rodent spinal cord to the ISMS-evoked stimulation sites illustrated in Figure 6 (Nicolopoulos-Stournaras and Iles 1983, Mohan, Tosolini et al. 2015). This comparison is limited, as we recorded from only a subset of the motor neuron pools existing at this spinal level. For each movement category, the rostrocaudal extent over which ISMS could evoke the movement closely overlapped the appropriate rostrocaudal motor neuron locations. ISMS could evoke these movements slightly beyond the rostral extent of the motor neuron column for each muscle and ended within the rostrocaudal range of the motor neuron column, but not further caudally. Exceptions included knee extension (via the vastus lateralis motor neuron column) and ankle flexion (via the tibialis anterior motor neuron column) that extend somewhat caudal to the motor neuron columns.
Due to the high spatial selectivity that can be achieved with ISMS, it is tempting to seek ways to engage site-specific “movement primitives” that may be activated discretely for neuroprosthetic control (Mushahwar, Aoyagi et al. 2004). However, even with optimal electrode design and low current intensities, site specificity is limited anatomically by the overlap of motor neuron columns in the cord as well as the geography of interneurons and fibers of passage. Further, intrinsic spinal mechanisms, including engagement of propriospinal circuitry, also contribute to co-activation of specific muscle groups, and thus, results of stimulation are not always predictable based on motor neuron location alone. These challenges for ISMS in neuroprosthetic design remain challenging for translation to clinical applications (Giszter 2015).
Significance of Present Results for Neuroprosthetic Development
Recently, neuroprosthetic approaches to restore function have sought to take advantage of intact neural structures below the level of injury by developing brain-computer-spinal cord (BCSC) interface devices that discriminate neural activity in the intact motor cortex to use as signals to activate motor neurons below the spinal lesion (Shahdoost, Frost et al. 2015) or the contraction of individual skeletal muscles (Ethier, Oby et al. 2012). The development of these devices using ISMS continues to evolve through the use of animal models of SCI. The topographic map derived in this study can aid the development of BCSC interface devices that apply the use of ISMS by guiding the placement of the stimulating electrode within the hindlimb spinal cord.
The need for methods to advance neurological rehabilitation is well known, since there currently is no cure for spinal cord injury. Patients with SCI may be able to live a virtually normal lifespan with sophisticated postoperative care but are left with chronic paralysis below the spinal cord lesion. BCSC interface devices, in which recorded signals from the motor cortex drive stimulating electrodes in the spinal cord to evoke movement, are becoming more feasible (Shahdoost, Frost et al. 2014, Shahdoost, Mohseni et al. 2014, Shahdoost, Frost et al. 2015). However, the overall design of these devices and final placement parameters are still challenging issues that have yet to be overcome. The development of reliable topographic motor maps derived via ISMS may provide a better understanding in the chronic placement of BCSC devices, and thus lead to more precise ways of restoring neurological function and improve the quality of life in patients with SCI.
Conclusions
The topographic distribution of hindlimb movements evoked by intraspinal microstimulation in rats was described. Movements and EMG activity were evoked with low current levels (<10 µA) at short latency and corresponded well with the distribution of motor neuron pools within the spinal cord. These data will inform the further development of BCSC devices by guiding the location of stimulating microelectrodes in the lumbar spinal cord, as well as provide guidance for the development of stimulation parameters.
Acknowledgments
This work was supported by a generous gift from the Ronald D. Deffenbaugh Family Foundation and an NIH T32 institutional training grant (HD057850).
Footnotes
Author contributions to the study and manuscript preparation include the following. Conception and design: Borrell, Frost, Nudo. Acquisition of data: Borrell, Frost, Peterson. Analysis and interpretation of data: Borrell, Frost, Peterson, Nudo. Drafting of article: Borrell, Frost, Peterson, Nudo. Critically revising the article: Borrell, Frost, Nudo. Reviewed submitted version of manuscript: Borrell, Frost, Nudo. Approved the final version of the manuscript on behalf of all authors: Borrell, Frost, Nudo. Statistical analysis: Borrell, Nudo. Study supervision: Nudo.
References
- Alam M, Garcia-Alias G, Shah PK, Gerasimenko Y, Zhong H, Roy RR, Edgerton VR. Evaluation of optimal electrode configurations for epidural spinal cord stimulation in cervical spinal cord injured rats. J Neurosci Methods. 2015;247:50–57. doi: 10.1016/j.jneumeth.2015.03.012. [DOI] [PMC free article] [PubMed] [Google Scholar]
- Anderson KD. Targeting recovery: priorities of the spinal cord-injured population. J Neurotrauma. 2004;21(10):1371–1383. doi: 10.1089/neu.2004.21.1371. [DOI] [PubMed] [Google Scholar]
- Angeli CA, Edgerton VR, Gerasimenko YP, Harkema SJ. Altering spinal cord excitability enables voluntary movements after chronic complete paralysis in humans. Brain. 2014;37(Pt 5):1394–1409. doi: 10.1093/brain/awu038. [DOI] [PMC free article] [PubMed] [Google Scholar]
- Bamford JA, Mushahwar VK. Intraspinal microstimulation for the recovery of function following spinal cord injury. Prog Brain Res. 2011;194:227–239. doi: 10.1016/B978-0-444-53815-4.00004-2. [DOI] [PMC free article] [PubMed] [Google Scholar]
- Bamford JA, Putman CT, Mushahwar VK. Intraspinal microstimulation preferentially recruits fatigue-resistant muscle fibres and generates gradual force in rat. J Physiol. 2005;569(Pt 3):873–884. doi: 10.1113/jphysiol.2005.094516. [DOI] [PMC free article] [PubMed] [Google Scholar]
- Bamford JA, Todd KG, Mushahwar VK. The effects of intraspinal microstimulation on spinal cord tissue in the rat. Biomaterials. 2010;31(21):5552–5563. doi: 10.1016/j.biomaterials.2010.03.051. [DOI] [PMC free article] [PubMed] [Google Scholar]
- Cazalets JR, Borde M, Clarac F. Localization and Organization of the Central Pattern Generator for Hindlimb Locomotoion in Newborn Rat. The Journal of Neuroscience. 1995;15(7):4943–4951. doi: 10.1523/JNEUROSCI.15-07-04943.1995. [DOI] [PMC free article] [PubMed] [Google Scholar]
- Ethier C, Oby ER, Bauman MJ, Miller LE. Restoration of grasp following paralysis through brain-controlled stimulation of muscles. Nature. 2012;485(7398):368–371. doi: 10.1038/nature10987. [DOI] [PMC free article] [PubMed] [Google Scholar]
- Frost SB, Iliakova M, Dunham C, Barbay S, Arnold P, Nudo RJ. Reliability in the location of hindlimb motor representations in Fischer-344 rats: laboratory investigation. J Neurosurg Spine. 2013;19(2):248–255. doi: 10.3171/2013.4.SPINE12961. [DOI] [PMC free article] [PubMed] [Google Scholar]
- Gelderd JB, Chopin SF. The vertebral level of origin of spinal nerves in the rat. Anat Rec. 1977;188(1):45–47. doi: 10.1002/ar.1091880106. [DOI] [PubMed] [Google Scholar]
- Giszter SF. Spinal primitives and intra-spinal micro-stimulation (ISMS) based prostheses: a neurobiological perspective on the “known unknowns” in ISMS and future prospects. Front Neurosci. 2015;9:72. doi: 10.3389/fnins.2015.00072. [DOI] [PMC free article] [PubMed] [Google Scholar]
- Gould HJ, III, Cusick CG, Pons TP, Kaas JH. The Relationships of Corpus Callosum Connections to Electrical Stimulation Maps of Motor, Supplementary Motor, and the Frontal Eye Fields in Owl Monkeys. The Journal of Comparative Neurology. 1986;247:297–325. doi: 10.1002/cne.902470303. [DOI] [PubMed] [Google Scholar]
- Hagg T, Baker KA, Emsley JG, Tetzlaff W. Prolonged local neurotrophin-3 infusion reduces ipsilateral collateral sprouting of spared corticospinal axons in adult rats. Neuroscience. 2005;130(4):875–887. doi: 10.1016/j.neuroscience.2004.10.018. [DOI] [PubMed] [Google Scholar]
- Harkema S, Gerasimenko Y, Hodes J, Burdick J, Angeli C, Chen Y, Ferreira C, Willhite A, Rejc E, Grossman RG, Edgerton VR. Effect of epidural stimulation of the lumbosacral spinal cord on voluntary movement, standing, and assisted stepping after motor complete paraplegia: a case study. The Lancet. 2011;377(9781):1938–1947. doi: 10.1016/S0140-6736(11)60547-3. [DOI] [PMC free article] [PubMed] [Google Scholar]
- Hudson HM, Griffin DM, Belhaj-Saif A, Cheney PD. Properties of primary motor cortex output to hindlimb muscles in the macaque monkey. J Neurophysiol. 2015;113(3):937–949. doi: 10.1152/jn.00099.2014. [DOI] [PMC free article] [PubMed] [Google Scholar]
- Imai T, Aoki M. Tracing of corticospinal fibers by extracellular pressure-injection of biocytin into the motor cortex in rats. Neurosci Res. 1993;16(3):229–233. doi: 10.1016/0168-0102(93)90128-d. Erratum in: 1993 Jul; 17(2):183. [DOI] [PubMed] [Google Scholar]
- Kasten MR, Sunshine MD, Secrist ES, Horner PJ, Moritz CT. Therapeutic intraspinal microstimulation improves forelimb function after cervical contusion injury. J Neural Eng. 2013;10(4):044001. doi: 10.1088/1741-2560/10/4/044001. [DOI] [PMC free article] [PubMed] [Google Scholar]
- Migliorini C, Tonge B, Taleporos G. Spinal cord injury and mental health. Aust N Z J Psychiatry. 2008;42(4):309–314. doi: 10.1080/00048670801886080. [DOI] [PubMed] [Google Scholar]
- Mohan R, Tosolini AP, Morris R. Segmental distribution of the motor neuron columns that supply the rat hindlimb: A muscle/motor neuron tract-tracing analysis targeting the motor end plates. Neuroscience. 2015;307:98–108. doi: 10.1016/j.neuroscience.2015.08.030. [DOI] [PubMed] [Google Scholar]
- Montgomery KL, Yeh AJ, Ho JS, Tsao V, Mohan Iyer S, Grosenick L, Ferenczi EA, Tanabe Y, Deisseroth K, Delp SL, Poon AS. Wirelessly powered, fully internal optogenetics for brain, spinal and peripheral circuits in mice. Nat Methods. 2015;12(10):969–974. doi: 10.1038/nmeth.3536. [DOI] [PMC free article] [PubMed] [Google Scholar]
- Moritz CT, Lucas TH, Perlmutter SI, Fetz EE. Forelimb movements and muscle responses evoked by microstimulation of cervical spinal cord in sedated monkeys. J Neurophysiol. 2007;97(1):110–120. doi: 10.1152/jn.00414.2006. [DOI] [PubMed] [Google Scholar]
- Mushahwar VK, Aoyagi Y, Stein RB, Prochazka A. Movements generated by intraspinal microstimulation in the intermediate gray matter of the anesthetized, decerebrate, and spinal cat. Can J Physiol Pharmacol. 2004;82(8–9):702–714. doi: 10.1139/y04-079. [DOI] [PubMed] [Google Scholar]
- Mushahwar VK, Collins DF, Prochazka A. Spinal cord microstimulation generates functional limb movements in chronically implanted cats. Exp Neurol. 2000;163(2):422–429. doi: 10.1006/exnr.2000.7381. [DOI] [PubMed] [Google Scholar]
- Mushahwar VK, Horch KW. Selective Activation of Muscle Groups in the Feline Hindlimb Through Electrical Microstimulation of the Ventral Lumbo-Sacral Spinal Cord. IEEE Transactions on Rehabilitation Engineering. 2000;8(10):11–21. doi: 10.1109/86.830944. [DOI] [PubMed] [Google Scholar]
- National Spinal Cord Injury Statistical Center, B., Alabama. Spinal Cord Injury Facts and Figures at a Glance. 2016. [Google Scholar]
- Nicolopoulos-Stournaras S, Iles JF. Motor Neuron Columns in the Lumbar Spinal Cord of the Rat. The Journal of Comparative Neurology. 1983;217:75–85. doi: 10.1002/cne.902170107. [DOI] [PubMed] [Google Scholar]
- Nudo RJ, Masterton RB. Descending pathways to the spinal cord, III: Sites of origin of the corticospinal tract. J Comp Neurol. 1990;296(4):559–583. doi: 10.1002/cne.902960405. [DOI] [PubMed] [Google Scholar]
- Padmanabhan R, Singh S. Observations on the topographical relations of spinal nerve roots in the rat. Acta Anat (Basel) 1979;105(3):378–380. doi: 10.1159/000145142. [DOI] [PubMed] [Google Scholar]
- Rejc E, Angeli C, Harkema S. Effects of Lumbosacral Spinal Cord Epidural Stimulation for Standing after Chronic Complete Paralysis in Humans. PLoS One. 2015;10(7):e0133998. doi: 10.1371/journal.pone.0133998. [DOI] [PMC free article] [PubMed] [Google Scholar]
- Saigal R, Renzi C, Mushahwar VK. Intraspinal Microstimulation Generates Functional Movements After Spinal-Cord Injury. IEEE Transactions on Neural Systems and Rehabilitation Engineering. 2004;12(4):430–440. doi: 10.1109/TNSRE.2004.837754. [DOI] [PubMed] [Google Scholar]
- Sayenko DG, Angeli C, Harkema SJ, Edgerton VR, Gerasimenko YP. Neuromodulation of evoked muscle potentials induced by epidural spinal-cord stimulation in paralyzed individuals. J Neurophysiol. 2014;111(5):1088–1099. doi: 10.1152/jn.00489.2013. [DOI] [PMC free article] [PubMed] [Google Scholar]
- Schoenfeld AJ, Laughlin MD, McCriskin BJ, Bader JO, Waterman BR, Belmont PJ., Jr Spinal injuries in United States military personnel deployed to Iraq and Afghanistan: an epidemiological investigation involving 7877 combat casualties from 2005 to 2009. Spine (Phila Pa 1976) 2013;38(20):1770–1778. doi: 10.1097/BRS.0b013e31829ef226. [DOI] [PubMed] [Google Scholar]
- Shahdoost S, Frost S, Dunham C, DeJong S, Barbay S, Nudo R, Mohseni P. Cortical control of intraspinal microstimulation: Toward a new approach for restoration of function after spinal cord injury. Conf Proc IEEE Eng Med Biol Soc. 2015;2015:2159–2162. doi: 10.1109/EMBC.2015.7318817. [DOI] [PubMed] [Google Scholar]
- Shahdoost S, Frost SB, Van Acker GM, 3rd, DeJong S, Dunham C, Barbay S, Nudo RJ, Mohseni P. Towards a Miniaturaized Brain-Machine-Spinal Cord Interface (BMSI) for Restoration of Function after Spinal Cord Injury. IEEE Eng Med Biol Soc. 2014:486–489. doi: 10.1109/EMBC.2014.6943634. [DOI] [PubMed] [Google Scholar]
- Shahdoost S, Mohseni P, Frost SB, Nudo RJ. A Multichannel Coricospinal Interface IC for Intracortical Spike Recording and Distinct Muscle Pattern Activation via Intraspinal Microstimulation. 2014 IEEE 57th International Midwest Sympsium on Circuits and Systems (MWSCAS) College Station, TX. 2014:310–313. [Google Scholar]
- Sharpe AN, Jackson A. Upper-limb muscle responses to epidural, subdural and intrapsinal stimulation of the cervicel spinal cord. J Neural Eng. 2014;11(1) doi: 10.1088/1741-2560/11/1/016005. [DOI] [PMC free article] [PubMed] [Google Scholar]
- Sunshine MD, Cho FS, Lockwood DR, Fechko AS, Kasten MR, Moritz CT. Cervical intraspinal microstimulation evokes robust forelimb movements before and after injury. J Neural Eng. 2013;10(3):036001. doi: 10.1088/1741-2560/10/3/036001. [DOI] [PMC free article] [PubMed] [Google Scholar]
- Tresch MC, Bizzi E. Responses to spinal microstimulation in the chronically spinalized rat and their relationship to spinal systems activated by low threshold cutaneous stimulation. Exp. Brain Res. 1999;129:401–416. doi: 10.1007/s002210050908. [DOI] [PubMed] [Google Scholar]
- Wenger N, Moraud EM, Gandar J, Musienko P, Capogrosso M, Baud L, Le Goff CG, Barraud Q, Pavlova N, Dominici N, Minev IR, Asboth L, Hirsch A, Duis S, Kreider J, Mortera A, Haverbeck O, Kraus S, Schmitz F, DiGiovanna J, van den Brand R, Bloch J, Detemple P, Lacour SP, Bezard E, Micera S, Courtine G. Spatiotemporal neuromodulation therapies engaging muscle synergies improve motor control after spinal cord injury. Nat Med. 2016;22(2):138–145. doi: 10.1038/nm.4025. [DOI] [PMC free article] [PubMed] [Google Scholar]
- Young W. Electrical stimulation and motor recovery. Cell Transplant. 2015;24(3):429–446. doi: 10.3727/096368915X686904. [DOI] [PubMed] [Google Scholar]
- Zimmermann JB, Seki K, Jackson A. Reanimating the arm and hand with intraspinal microstimulation. J Neural Eng. 2011;8(5):054001. doi: 10.1088/1741-2560/8/5/054001. [DOI] [PMC free article] [PubMed] [Google Scholar]


