
Figure 1.
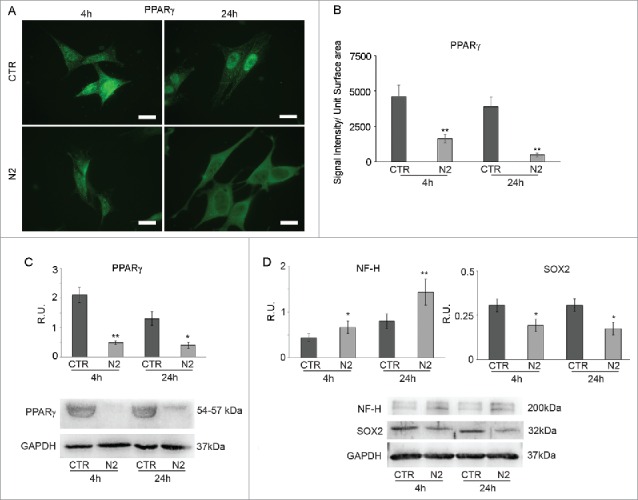
PPARγ IF in SH-SY5Y during differentiation (A). Undifferentiated (CTR) and differentianted (N2) cells at 4h and 24h from N2 treatment Bar = 10 μm. B: PPARγ IF quantification expressed as Signal Intensity/Unit Surface Area. C: WB and relative densitometric analyses for PPARγ in undifferentiated (CTR) and differentiated (N2) cells at the indicated time-points. D: WB and relative densitometric analyses for NF-H and SOX2 in undifferentiated (CTR) and differentiating (N2) cells at the indicated time-points. The relative densities of the immunoreactive bands were determined and normalized with respect to GAPDH, using a semiquantitative densitometric analysis. Data are mean ± SE of 4 different experiments. *P ≤ 0.05 and **P ≤ 0.005.