
Figure 5.
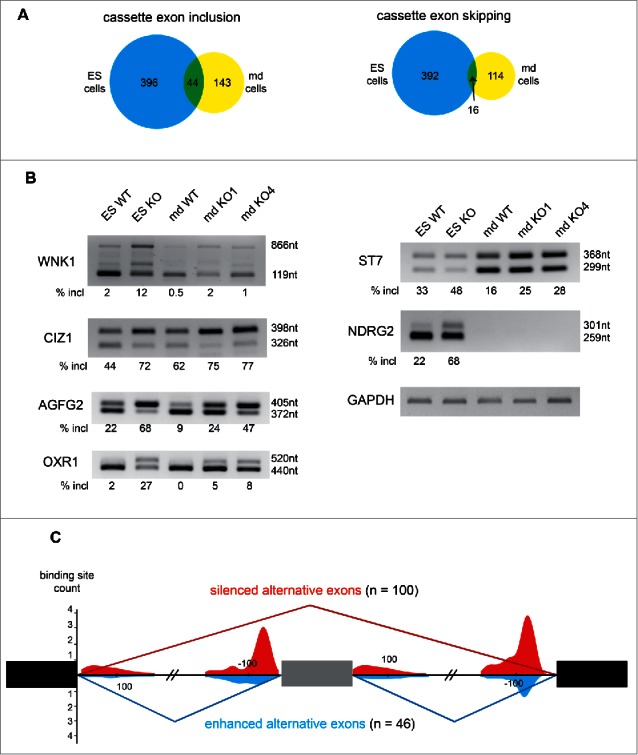
Comparison of Alternative splicing changes in mouse mandibular and ES cells depleted of RBM10. (A) Venn diagram showing the overlap of included or skipped cassette exons in RBM10 KO mandibular (md) and ES cells. (B) Validation of alternative cassette exon inclusion in RBM10 KO cells by RT-PCR. The size of the 2 PCR products (with or without the inclusion of the cassette exon), as well as the percentage of inclusion (estimated after quantification of the transcripts abundance by an Agilent Bioanalyzer) is indicated. We validated the splicing changes in 2 of the RBM10 KO md cells, as well as in the RBM10 KO ES cells. For AGFG2, OXR1, WNK1 and CIZ1, similar changes were observed in the 2 cells lines. ST7 splicing changes is more prominent in mandibular cells while NDRG2 splicing changes was only observed in ES cells. (C) RNA splicing map of RBM10 in mandibular cells. The count density of RBM10 cross-linked nucleotide positions was assessed for regulated alternative exons (100 silenced in red and 46 enhanced cassette exons in blue) in the introns upstream and downstream of the event.