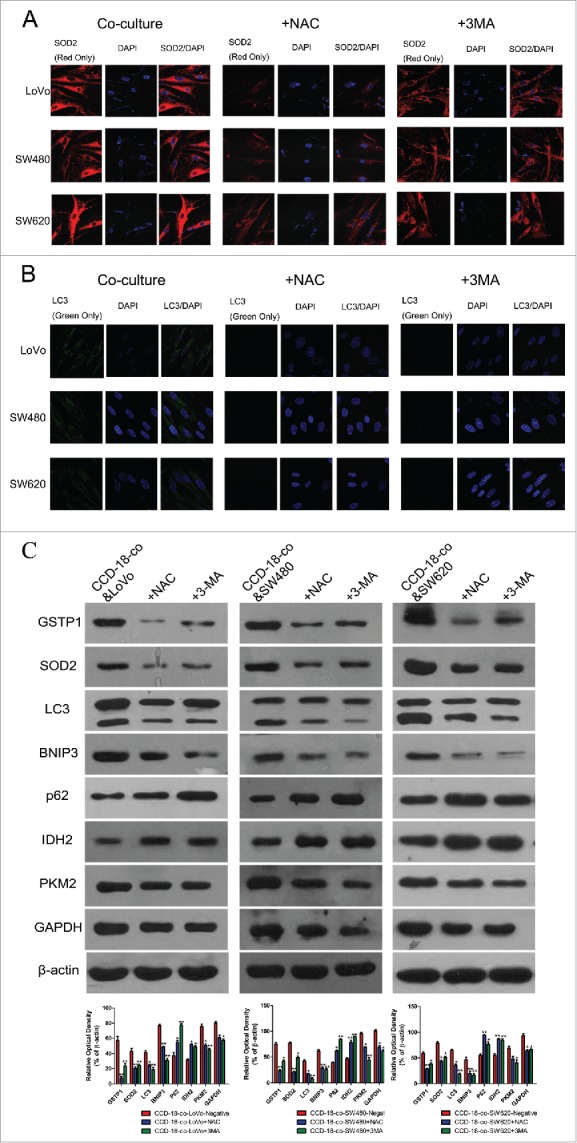
Figure 4.

Expression changes of metabolic related proteins in CCD-18-co after being treated with inhibitor NAC or 3-MA. (A) Immunofluorescence observation of SOD2 (red) in co-cultured CCD-18-co cells in the presence of oxidative stress inhibitor NAC or autophagy inhibitor 3-MA (63×). (B) Immunofluorescence observation of LC3 (green) in co-cultured CCD-18-co cells in the presence of oxidative stress inhibitors NAC or autophagy inhibitor 3-MA (63×). (C) Expression of metabolism related proteins (IDH2, PKM2, and GAPDH), oxidative stress related proteins (SOD2 and GSTP1) and autophagy related proteins (LC3, BNIP3, and p62) in CCDs co-cultured with colorectal cancer cells under treatment of NAC or 3-MA, respectively. β-actin served as loading control. *P < 0.05 vs. negative respectively, **P < 0.01 versus negative respectively.
