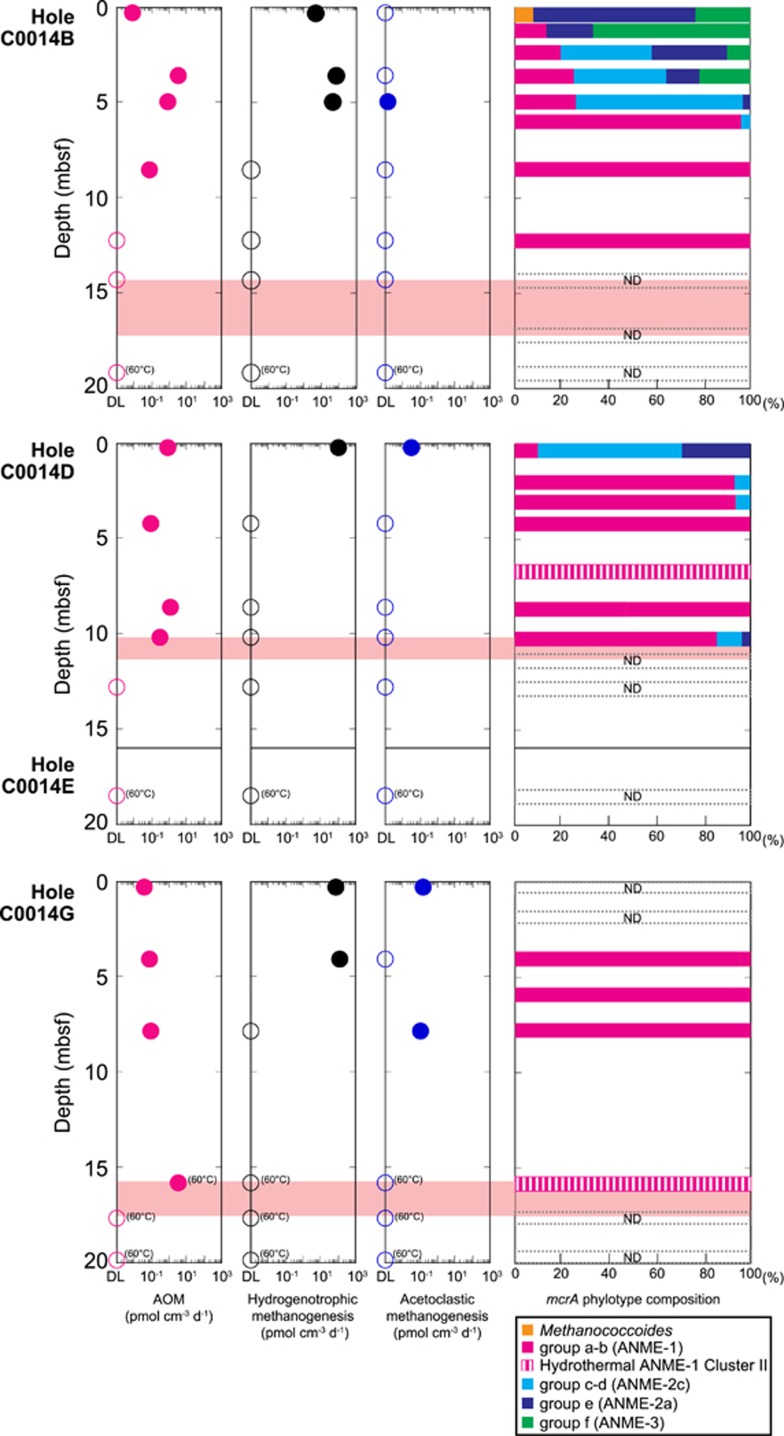
Figure 4.
Site C0014 depth profiles of the potential activity of AOM, hydrogenotrophic methanogenesis and acetoclastic methanogenesis (from left to right). The phylogenetic affiliation of mcrA genes is shown in the rightmost column. Open circles on the y-axes denote analyses below the detection limit. The red-shaded layers represent the possible depth limit of active subseafloor microbes, as determined in Figure 1.

