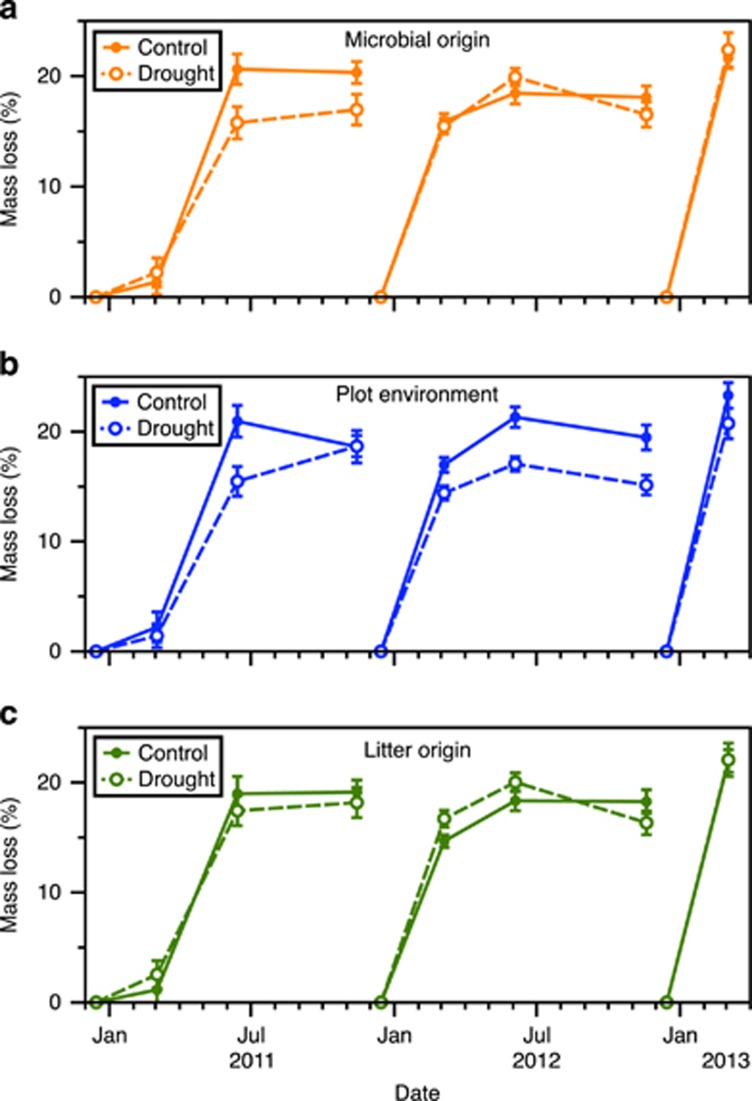
Figure 4.
Effect of (a) microbial origin, (b) plot environment and (c) litter origin on percentage mass loss in the drought experiment. N=32 for each treatment at each date. Error bars are ±1 s.e.m. See Supplementary Table S3 and Figure 3e for significance and effect sizes, respectively.

