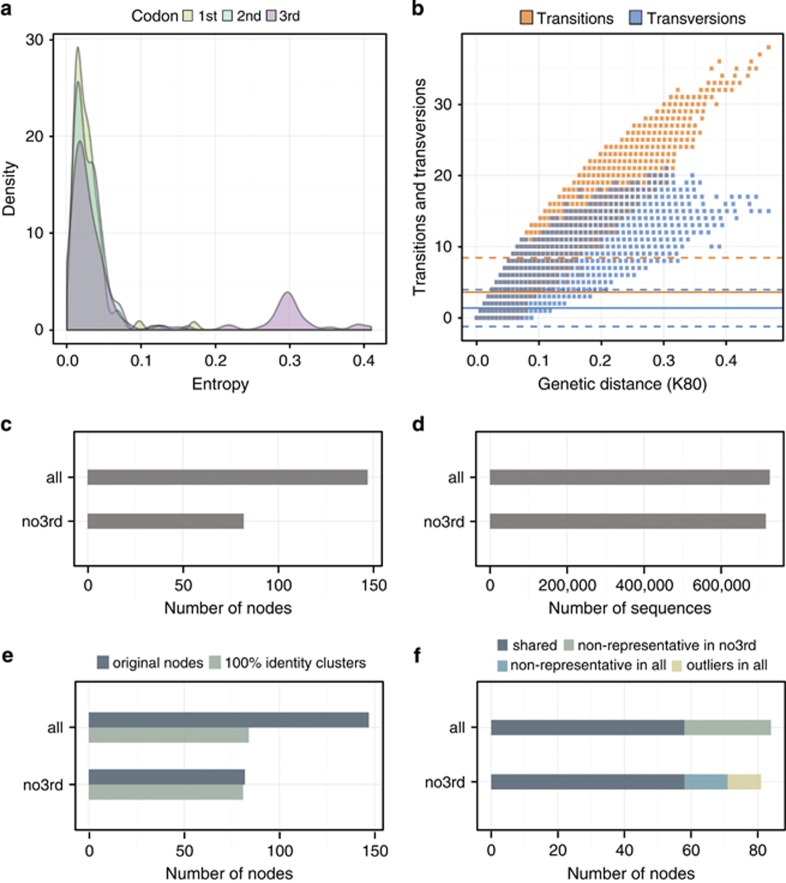
Figure 2.
MED partitioning analysis of R. baltica sequence dataset: distribution of the entropies values in each codon position (a); substitution saturation plots for the third codon position from one of the sub-sampling iterations with 10000 sequences (b); number of MED nodes for sequences with all codon positions (all) and sequences where the third codon position was removed (no3rd) (c); number of sequences contained in the final MED nodes (d); clustering of the final MED nodes on the aminoacid level at 100% identity for MED analysis when using all coding positions (all) compared to when the third codon position was removed (no3rd) (e); overlap between the nodes with and without the third codon position after the clustering at 100% identity on aminoacid level (f).

