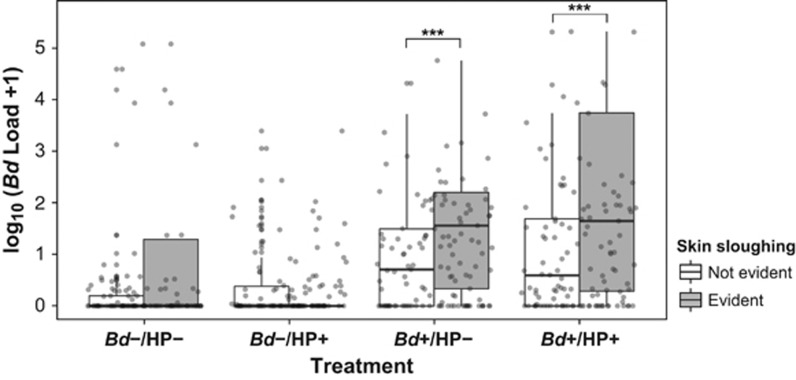
Figure 3.
Boxplot of log10(Bd load+1) classified by treatment and skin sloughing. Points represent the raw data. Asterisks denote significance of Tukey's pairwise comparisons from the mixed model term Treatment × Slough (Supplementary Table S2). An example of skin sloughing is shown in Supplementary Figure S2.

