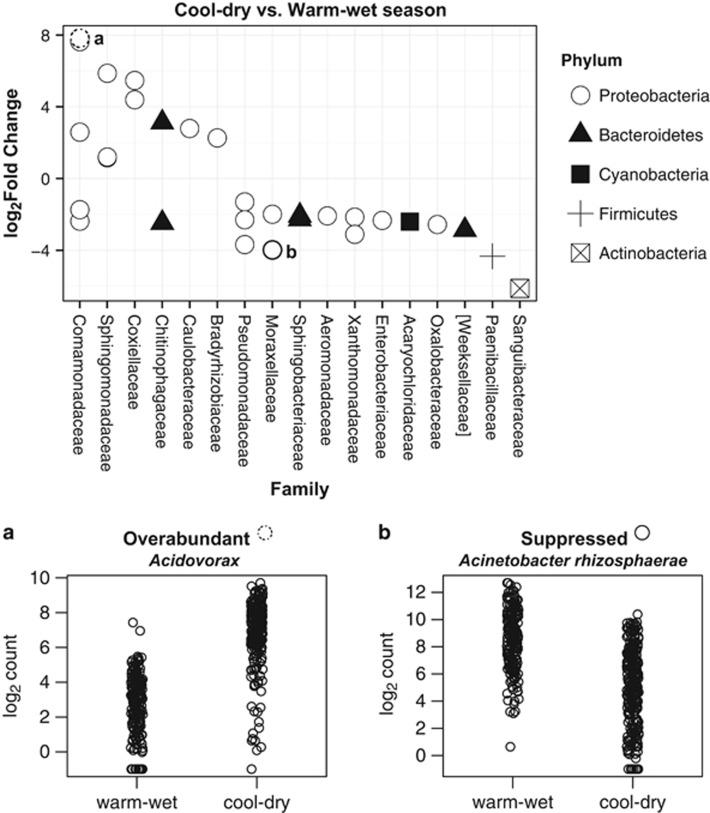
Figure 6.
Differential abundance of bacteria between the cool-dry season and the warm-wet season. Taxa above the zero line are significantly over abundant during the cool-dry season (a). In contrast, taxa below the zero line are significantly suppressed during the cool-dry season (b). We show two examples to illustrate the changes. Identities of each OTU can be found in Supplementary Table S7.

