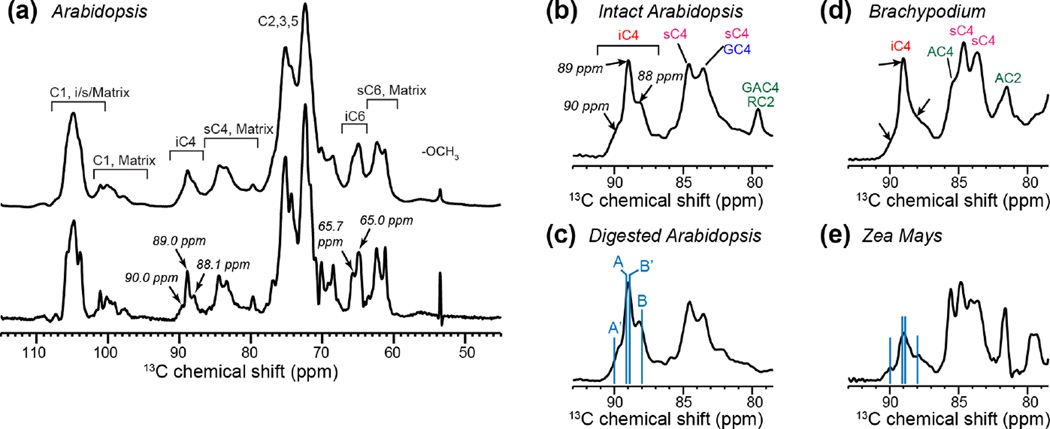
Figure 1.
1D 13C CP-MAS spectra of primary cell walls at high magnetic fields. (a) Never-dried Arabidopsis cell walls without (top) and with (bottom) resolution-enhanced window function. The spectrum was measured at 277 K on a 900 MHz spectrometer. The bottom spectrum is processed with a Gaussian function using LB=−140 and GB=0.6. (b-e) C4 region of the 13C spectra of various cell walls. The spectra were measured at 296 K on an 800 MHz NMR, and were processed with LB=−100 and GB=0.6. (b) Intact Arabidopsis cell wall. (c) Partially digested Arabidopsis cell wall. (d) Brachypodium cell wall. (e) Zea Mays cell wall. Blue lines in (c) and (e) guide the eye for the literature crystalline cellulose C4 chemical shifts in Iα (A and A’) and Iβ (B and B’) allomorphs.

