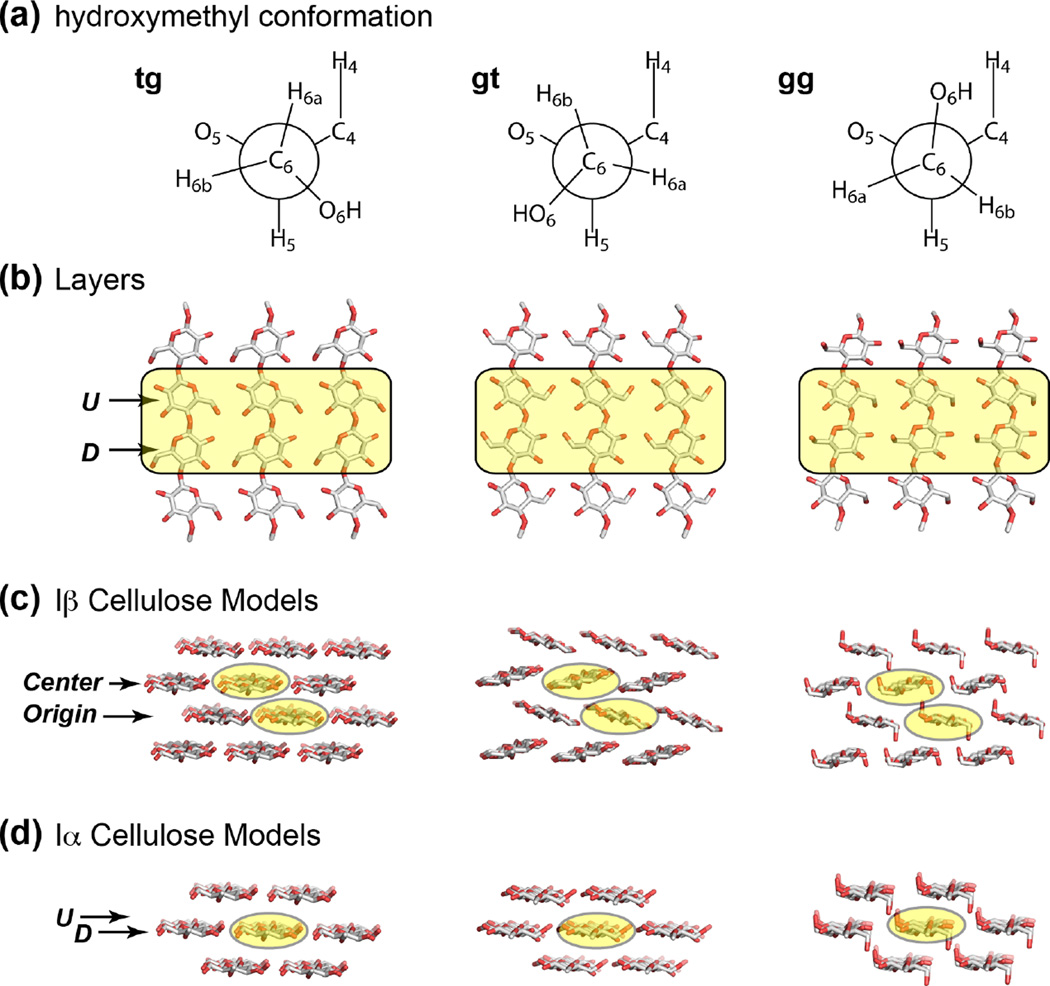
Figure 5.
Cellulose Iα and Iβ structural models with three different C6 conformations: tg, gt and gg from left to right). The shaded glucose residues in each layer were treated as the interior cellulose and were analyzed for 13C and 1H NMR chemical shifts. (a) The three C6 conformations. (b) Face view of a layer of glucan chains in cellulose. U and D denote the two non-equivalent residues in the Iα allomorph. (c) Side view of the Iβ model used to calculate NMR chemical shifts. The center and origin chains are formed by two types of glucose residues in the unit cell of the Iβ crystal structure. (d) Side view of the Iα cellulose structure model. The U and D glucose units alternate along the same chain.

