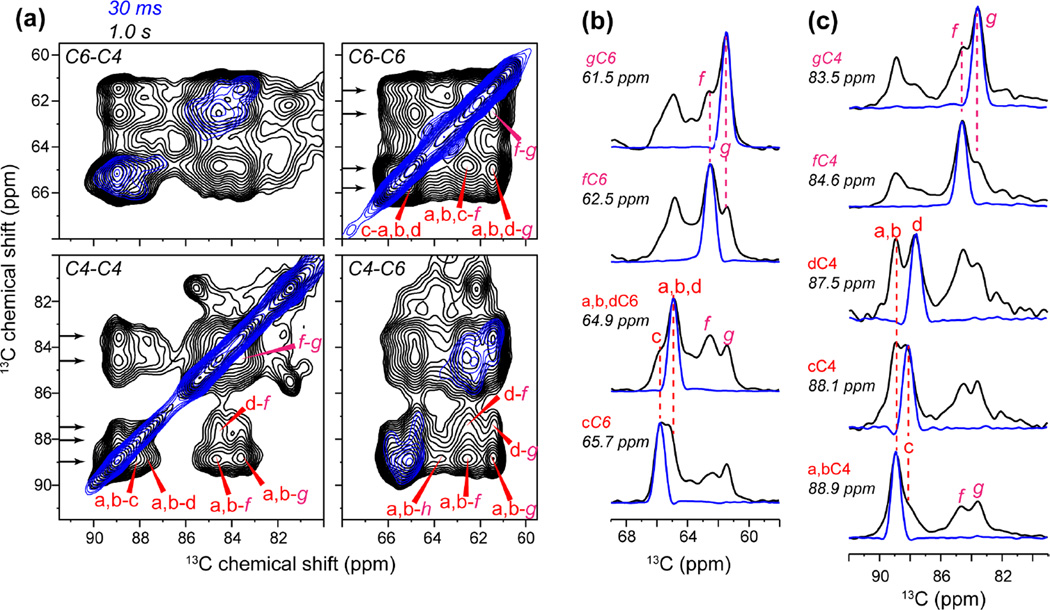
Figure 7.
Intermolecular cross peaks of Brachypodium primary wall cellulose from long-mixing-time 2D PDSD spectra. (a) Overlay of the 30 ms PDSD spectrum (blue) and the 1.0 s (black) PDSD spectrum. Long-range cross peaks are assigned. Arrows on the left indicate the extracted 1D cross sections in (b) and (c). (b) Cellulose C6 cross sections. (c) Cellulose C4 cross sections. Interior cellulose a, b, and d show stronger cross peaks with surface cellulose f and g compared to interior cellulose c.

