


Fig. 3. Fas protein expression and localization in cultured granulosa cells from DES- and eCG-primed immature rats in respond to IFN-γ (0-1,000 U/mL).
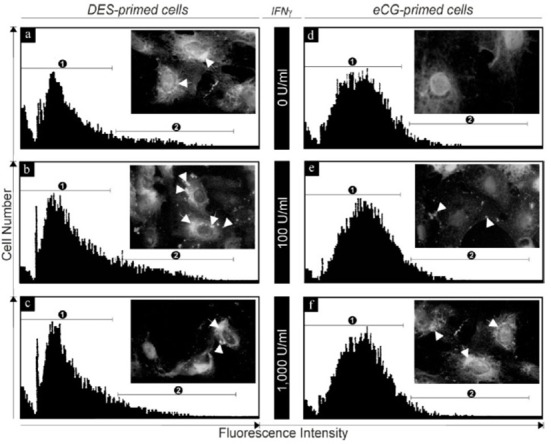
Insert in each flowcytogram shows representative fluorescence microphotograph of Fas immunocytochemistry (arrows and arrowheads indicate immunoreactivity in cytoplasm and membrane, respectively. Magnification: ×1,000). Numbers 1 and 2 in each flowcytogram indicate nonspecific (partially overlapped with low intensity of Fas-positive portion) and specific Fas-positive (high fluorescence intensity) portion, respectively.