


Fig. 4. Influence of IFN-γ pretreatment (100 U/mL) on apoptotic response induced by agonistic Fas mAb (1 µg/mL) in cultured granulosa cells from DES-primed immature rat ovaries.
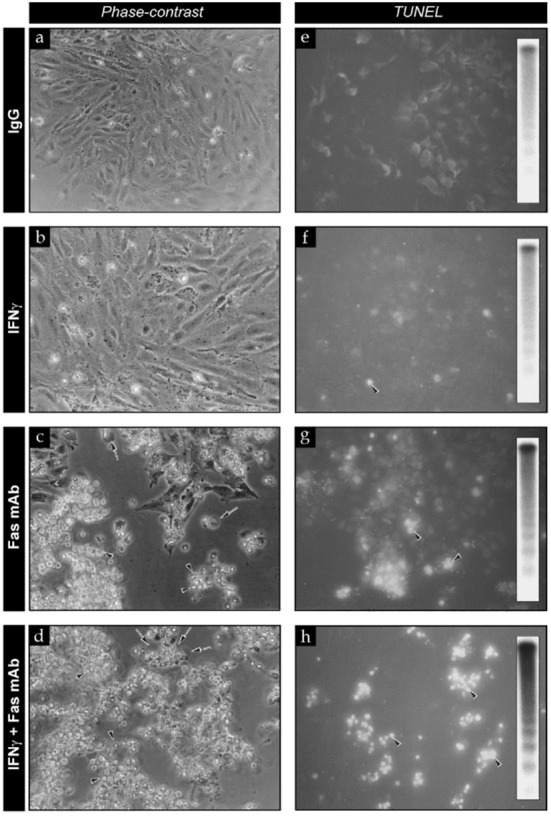
Left and right panels illustrate cellular morphology (phase-contrast microscopy) and in situ apoptotic cell detection (TUNEL), respectively. a and e, control group [IFN-γ vehicle (medium) (24 hr) + IgG (6 hr)]; b and f, IFN-γ group [IFN-γ (24 hr) + IgG (6 hr)]; c and g, Fas mAb group [IFN-γ vehicle (medium) (24 hr) + Fas mAb (6 hr)]; d and h, IFN-γ and Fas mAb group [IFN-γ (24 hr) + Fas mAb (6 hr)]. Arrows (in left panel) indicate membrane blebbing. Arrowheads in left and right panels indicate floating cells and TUNEL-positive cells, respecttively. Magnification: 400×. Inserts in right panels show representative apoptotic DNA fragmentation pattern in each treatment group.