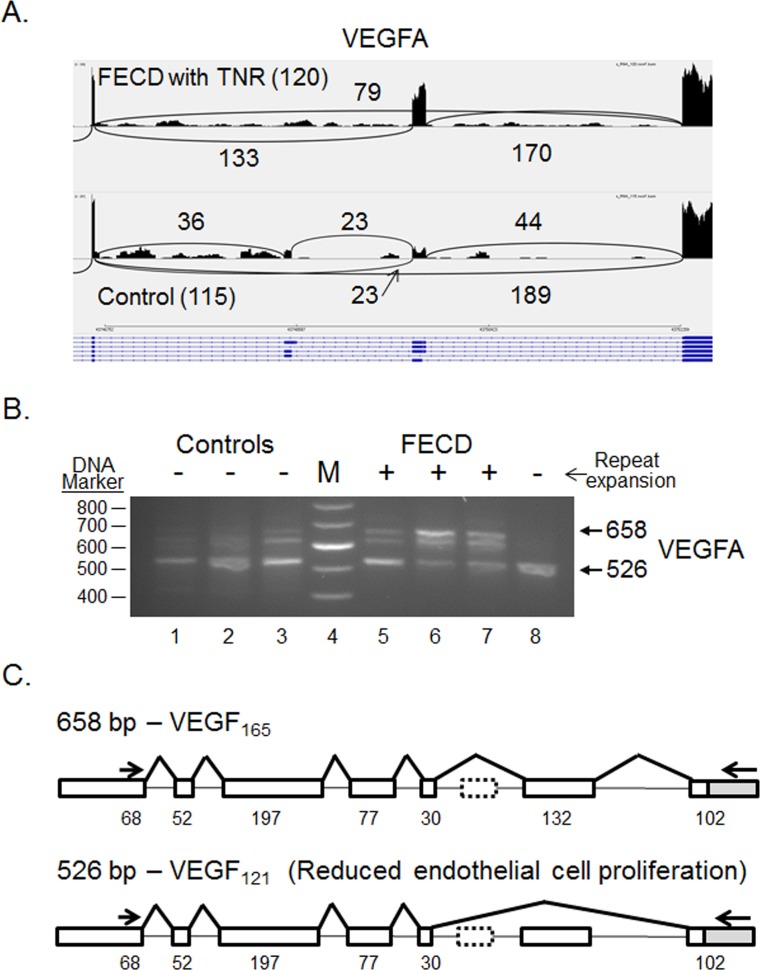
Figure 5.
Differential splicing of VEGFA transcripts in the CE. (A) Sashimi plot showing the number of reads spanning individual splice junctions next to lines connecting the exons involved. Alternative Ensembl transcript structures are shown at the bottom of the figure in blue. (B) RT-PCR using primers that flank selected exons was used to assess exon inclusion from VEGFA in corneal endothelial RNA samples from controls (lanes 1–3) and FECD patients (lanes 5–8). The repeat expansion status of each sample is shown (+, >45 repeats; − ≤45 repeats). Lane 4 contains DNA size markers. (C) The structure of two splice products from the VEGFA gene is shown. Exons of the VEGFA gene are shown as rectangles, and the length of the exon sequence included in each product is given. The location of the RT-PCR primers is shown by the arrows. The structure of the two products shown in bold (658 bp and 526 bp) was verified by Sanger sequencing.

