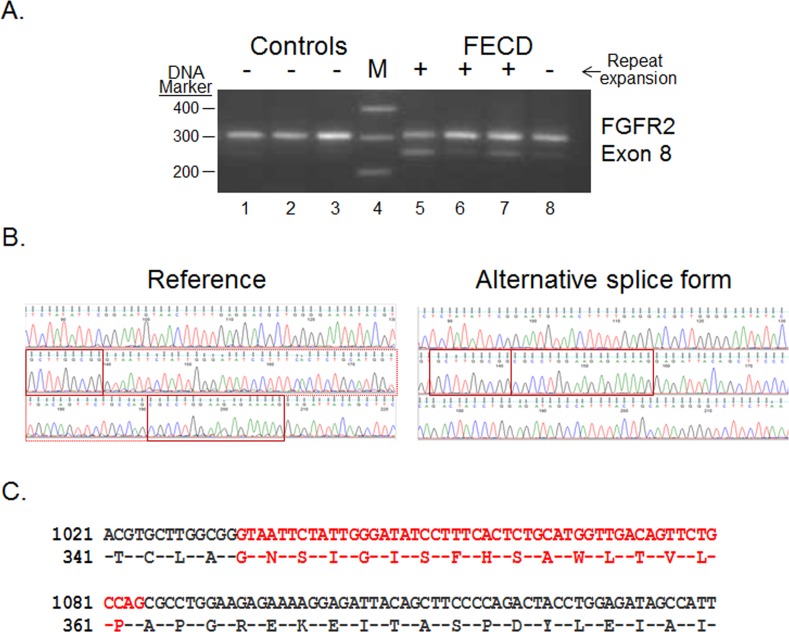
Figure 6.
Novel splicing event in FGFR2 transcripts in the CE (A) RT-PCR using primers that flank selected exons was used to assess exon inclusion from FGFR2 in corneal endothelial RNA samples from controls (lanes 1–3) and FECD patients (lanes 5–8). The repeat expansion status of each sample is shown (+, >45 repeats; ≤45 repeats). Lane 4 contains DNA size markers. (B) Sequence traces from the isolated upper (Reference) and lower (Alternative splice form) bands from Figure 6A are shown. The regions that flank the novel splice junction are boxed in red. (C) The predicted protein sequence of the novel FGFR2 isoform is shown. The region that is spliced out in the smaller isoform is shown in red.

