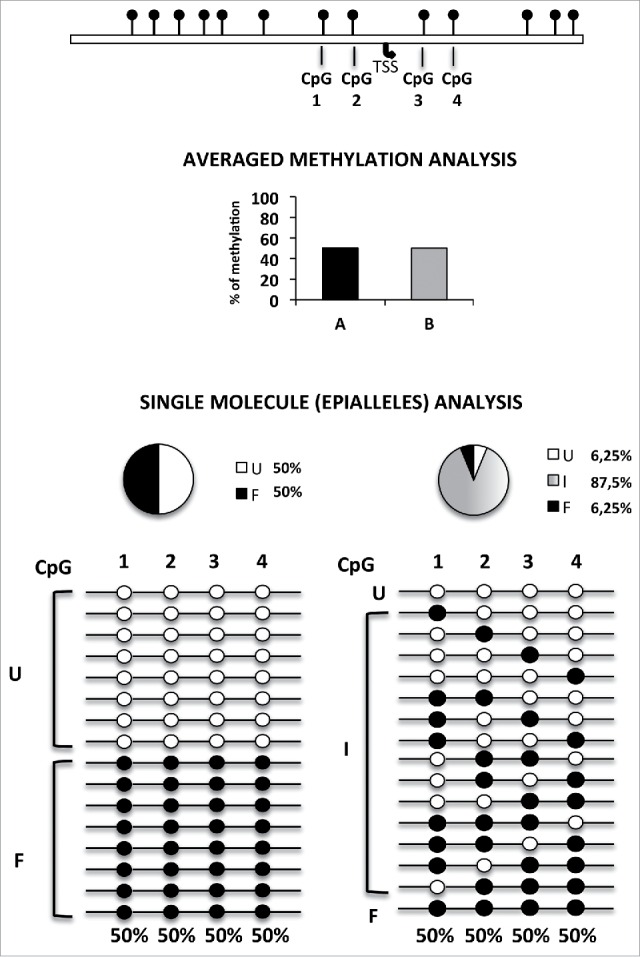
Figure 1.

Principle of epipolymorphism and epiallele analysis. Averaged methylation degree, even at single base resolution, does not give any information on cell-to-cell methylation variability. In the example reported in the Figure, which shows analysis of 4 adjacent CpG sites, 50% methylation degree may correspond to completely different methylation scenarios. These range from the lowest degree of epipolymorphism (bottom left) to the highest level (bottom right). However, reliable analysis of the relative frequency of each epiallele must rely on a high number of analyzed sequences. Compared to genomic approaches previously used to measure the general epipolymorphism degree, the here adopted amplicon bisulfite sequencing, although limited to targeted genomic regions, allowed us to magnify the details of cell-to-cell epiallele variability at single loci, thanks of the very high sequencing coverage (about 210,000 in this study) and to comprehensively establish the methylation pattern of several adjacent CpG sites of longer regions (up to 600–1000 bp) in which all CpGs within individual reads are effectively phased and may represent the epigenetic haplotype. TSS: transcription start site. The pie charts represent the percentage of fully unmethylated epialleles (U = white), fully methylated epialleles (F = black), and the 62 remaining possible methyl CpG combination or intermediate epialleles (I = gray gradient).
