
Figure 4.
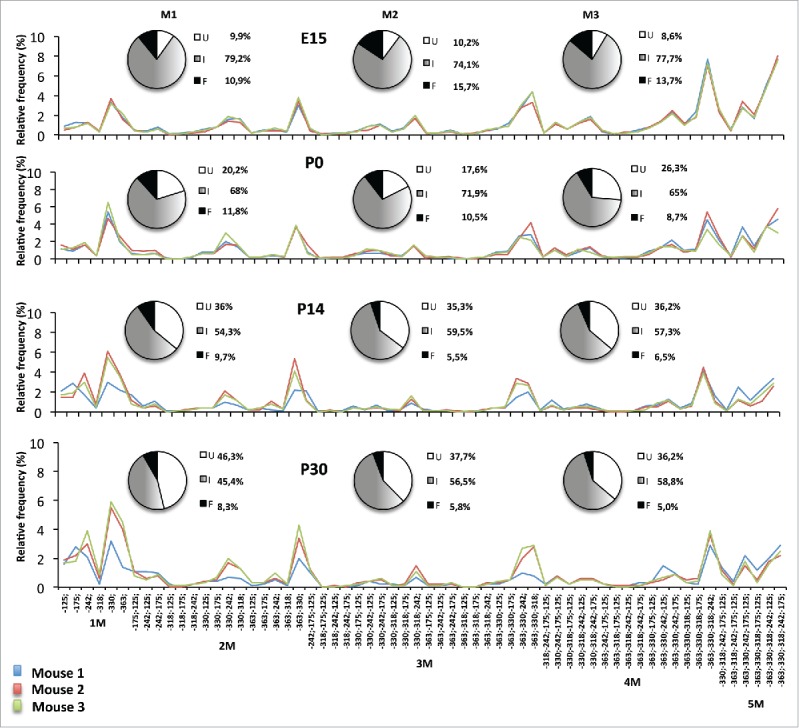
Epialleles frequency distribution at Ddo R4 region during different stages of mouse development (E15, P0, P14, P30). The pie charts represent the percentage of unmethylated epialleles (U = white), fully methylated epialleles (F = black), and all 62 intermediate epialleles (I = gray gradient). The line graph shows the percentage of each of the intermediate epialleles; each color line identifies one mouse. Blue = mouse 1; red = mouse 2, green = mouse 3. At the bottom of the last graph, the specific methyl CpG combinations of the 62 intermediate epialleles are reported. 1M identifies the group of monomethylated molecules; 2M = dimethylated; 3M = trimethylated; 4M = tetramethylated; 5M = pentamethylated epialleles. Pearson correlation R reported in Table 2.