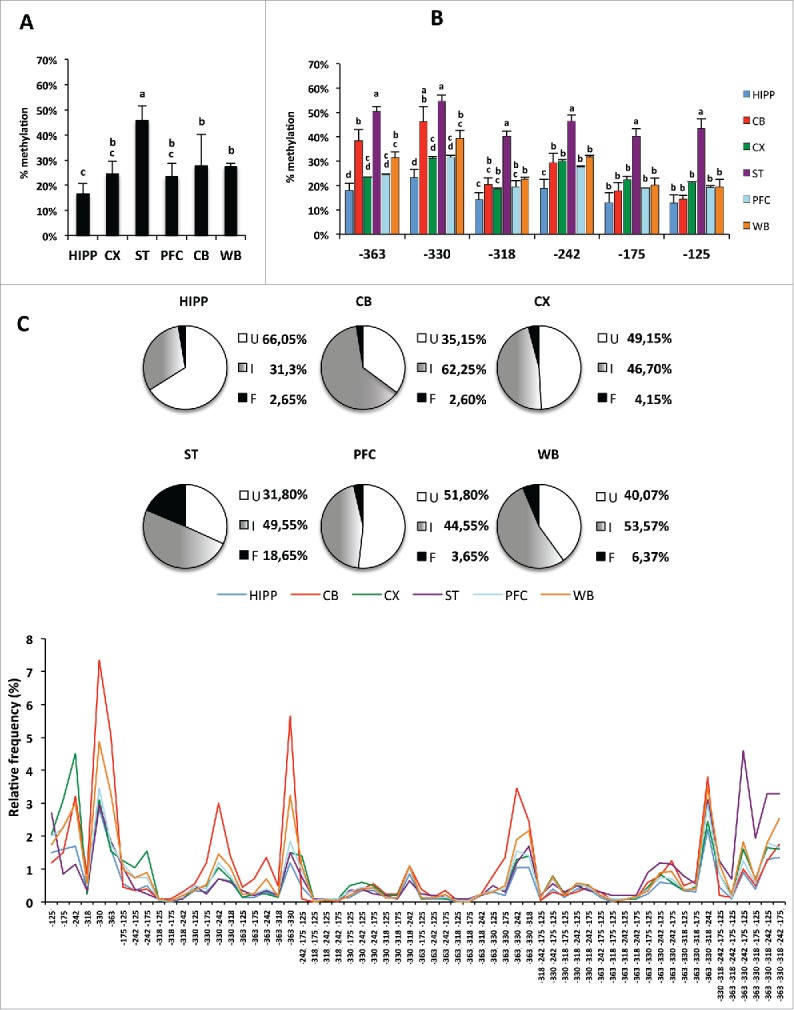
Figure 5.

Epiallele composition analysis of Ddo R4 in separated areas of mouse brain (Hipp: hippocampus; CB: cerebellum; CX: Cortex; ST: striatum; PFC: prefrontal cortex) and in whole brain (WB) at P30 stage. A) Average methylation at the Ddo R4 region in each separated brain area. The bars labeled with different letters on top are significantly different based on post-hoc ANOVA statistical analysis (Tukey test). B) Average methylation at each CpG site (−363, −330, −318, −242, −175, and −125). The bars labeled with different letters on top are significantly different based on post-hoc ANOVA analysis (Tukey test) performed for each CpG site. C) Ddo R4 region epiallele frequency distribution. The pie charts represent the percentage of unmethylated epialleles (U = white); fully methylated epialleles (F = black); and all 62 intermediate epialleles (I = gray gradient). Each color line represents the distribution of 62 intermediate epialleles in one brain area, as indicated. At the bottom of the graph, the specific methyl CpG combinations of each of the 62 intermediate epialleles are reported. A P-value ≤ 0.05 was considered statistically significant.
