
Figure 6.
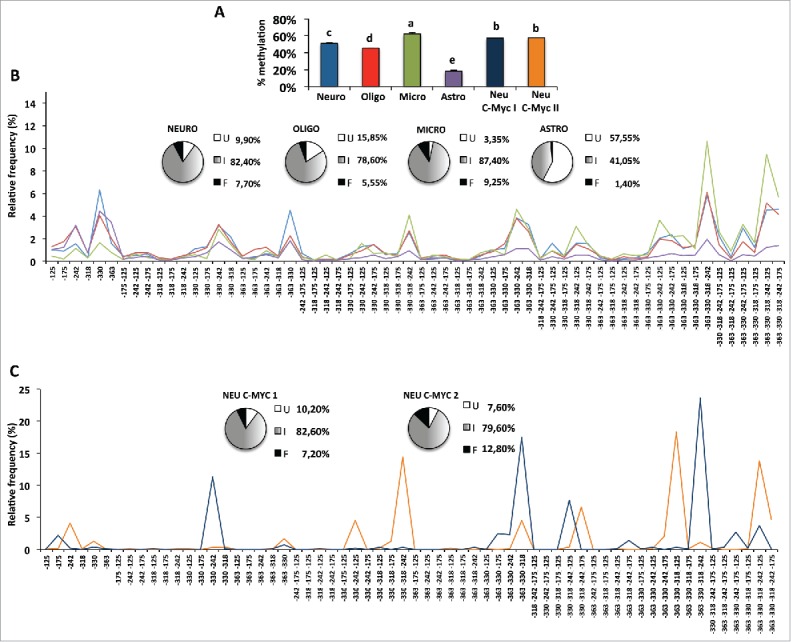
Averaged and single molecule methylation analysis of the Ddo promoter region in isolated primary brain cells and in cultured c-myc immortalized neurons. A) Average methylation in different indicated brain cells. The bars labeled with different letters on top are significantly different based on post-hoc ANOVA statistical analysis (Tukey test). B) Frequency distribution of intermediate epialleles in primary cells. C) Epiallele distribution in c-myc cultured immortalized neurons. Neuro: primary neurons, blue bars in A and blue lines in B. Oligo: primary oligodendrocytes, red bars in A and red lines in B. Micro: primary microglial cells, green bars in A and green lines in B. Astro: primary astrocytes cells, violet bars in A and violet lines in B. Neu C-Myc I and Neu C-Myc II: A1 C-Myc immortalized neurons, dark blue and orange, respectively, in A (bars) and C (lines). The pie charts represent the percentage of unmethylated epialleles (U = white); fully methylated epialleles (F = black); and all 62 intermediate epialleles (I = gray gradient). At the bottom of each graph, the specific methyl CpG combinations of each of the 62 intermediate epialleles are reported.